Global trade slows and supply chains remain unbalanced
Global trade is slowing over faltering consumer demand amid the energy and inflation crisis. Delays have eased and container rates have tumbled, but supply frictions remain
After a relatively strong first half of the year, global trade has entered the slow lane
Global merchandise trade has held up well so far this year given the volatile and uncertain environment, with world goods trade standing at 4.4% year-to-date (January to August) according to CPB world trade data. In the first half of the year, consumers’ appetite for goods was still running high compared to the year before, but with a shift back to services and travelling, and with people worrying about the rising cost of living, things changed over the summer.
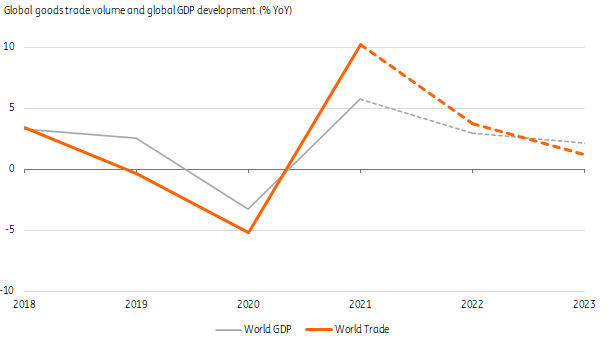
On the back of a relatively strong first half of the year, global trade will likely see a growth rate of 3.8% for the whole of 2022, but amid headwinds the pace is slowing quickly. For next year, we expect merchant trade growth to slow to just 1.2%, as discussed in more detail in our trade outlook for 2023. This falls behind expected GDP growth.
Mixed picture: intra-Asia trade and bulk flows hold up better
With consumer demand faltering, the energy and subsequent inflation crisis persisting, and ongoing labour and material shortages, there are simply not enough silver linings to keep global goods trade robustly flowing. Energy prices are very likely to remain high, burdening (industrial) companies’ cost competitiveness and households’ purchasing power, despite government compensation packages. While Europe is expected to see a flat year, the US is holding up better and intra-Asia trade is expected to push up the global average.
In terms of categories, the energy crisis tends to lead to more transport of energy carriers (like liquefied natural gas, or LNG). Demand for oil and oil products is continuing to catch up after the Covid-19 pandemic setback and this is expected to continue in 2023, despite weak economic perspectives. On the container side (predominantly consumer goods), there will be very little growth and will stick well below its long-term average. For dry bulk flows, 2023 is set to be a better year as industrial demand from China is expected to catch up compared to 2022.
Growth in world trade will stay behind world GDP in 2023

Resolved congestion at US bottleneck port illustrative of supply chain relief
Congested supply chains have improved recently. After an unprecedented wave of incoming containers, record throughput, and peaking congestion, the impressive backlog of waiting vessels at US bottleneck port LA-LB was almost cleared in September. A combination of the shift back to services and the rationalisation of consumer spending created an opposite ‘bullwhip effect’ of self-reinforcing inventory moderation across the supply chain. This temporarily pushed year-on-year throughput numbers deeper into negative territory in August and September. The current slack in consumer spending on goods (and normalisation) is also reflected in the package handling figures of FedEx which were down just over 10% year-on-year over the summer, and also the forward guidance of Amazon, which expects a more moderate fourth quarter and holiday season.
Falling container rates mark a turning point in transport costs for consumer goods
Softening demand has also sent spot rates on major trade lanes from Asia down, ending an extraordinary two-year period in container shipping, although locked-in contract rates slow the impact for shippers. But transport will be significantly cheaper next year. Yet, contrary to the container market, tanker rates have rallied after a difficult pandemic phase with lower oil demand – with the Ukraine war and oil bans having severe implications – for the oil and tanker market.
Elevated container spot rates on major trade lanes have plummeted

But supply chain performance hasn’t returned to normality yet
Supply chains are rebalancing in a volatile world. Although major ports have managed to get through unprecedented backlogs, there is still a way to go before normality returns. Smaller ports are still seeing relatively high delays and average ocean timelines are hovering around double pre-pandemic levels at around 80-90 days (cargo ex-work to leaving the port of destination). At the same time, arrival performance still has a long way to go to return to normal levels with just 45.5% of the container vessels arriving on time in September (the pre-pandemic two-year average is 74%).
2023 won’t be free of supply concerns as fragility and shortages remain
Despite improvements in logistics, manufacturing companies still face shortages of particular materials and components. The supply of chips has subsided, but mismatches persist and new shortages in, for example, battery metals loom. While recovering from the pandemic, the effects of the war in Ukraine as well as other geopolitical tensions have created new frictions in multiple markets. Russian trade bans have already led to trade inefficiencies such as longer routes, and the EU ban on Russian oil, which comes into force on 5 December, followed by a ban on refined products on 5 February, will add to that.
In Europe, the energy crisis has also forced energy-intensive companies in chemicals, glass and aluminium to reconsider production. This complex also explains why car maker VW sees ongoing supply chain constraints. And the situation in Ukraine remains unpredictable as the instant suspension of the grain deal by the end of October showed.
Supply chains in general remain exposed to a risk of strikes as inflation has eroded the purchasing power of workers in transportation and manufacturing. And in China recurring regional Covid-19 lockdowns remain a threat to supply chains, although they have become shorter and more focused.
All in all, trade demand is slowing, but supply chains remain unbalanced. You can read more on this in our 2023 trade and supply chain outlook.
This publication has been prepared by ING solely for information purposes irrespective of a particular user's means, financial situation or investment objectives. The information does not constitute investment recommendation, and nor is it investment, legal or tax advice or an offer or solicitation to purchase or sell any financial instrument. Read more
Download
Download article
4 November 2022
ING’s November Monthly: The long wait for the pivot This bundle contains 14 Articles
