- Quick take
- 28 May
- United States
Softer US inflation, but the energy squeeze on spending power is becoming obvious
The Federal Reserve's favoured inflation measure was not as hot as feared, but that will do little to deter policymakers from their increasingly hawkish bias. Nonetheless, consumer spending power is coming under increasing pressure with rising energy costs forcing households to save less to maintain lifestyles


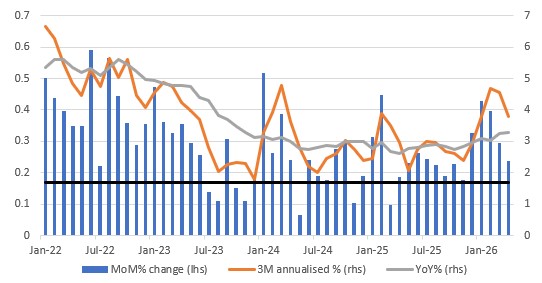
We've had quite a lot of US data today. The core PCE deflator (the Federal Reserve's favoured inflation measure) was better than expected, rising 0.2% month-on-month versus the 0.3% consensus forecast. Nonetheless, it continues to track above the 0.17% MoM run rate required to return annual inflation to the 2% target. The chart below shows that it was March 2025 when we last recorded a MoM reading below 0.17% – hence why the Fed is unlikely to cut rates again anytime soon and will likely retain a hawkish bias over the summer months, until policymakers are confident that the energy surge has passed and will start to reverse. But that requires a deal to re-open the Strait of Hormuz.
Core PCE deflator metrics (MoM%, 3M annualised & YoY%)
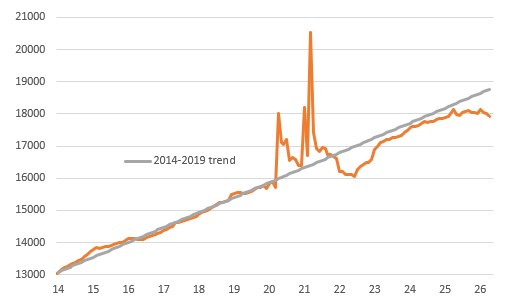
Meanwhile, 1Q GDP was revised lower, from 2% down to 1.6%, due to a combination of softer than previously thought consumer spending (1.4% versus 1.6% initially reported) and a bigger drag from inventories. The larger problem was the monthly personal income and spending data tied to this. Real household spending rose only 0.1% MoM in April, suggesting a soft start to 2Q activity – remember that 70% of the US economy is consumer spending and indicates that higher gasoline prices are not only a problem for inflation, but activity too. It is eating into spending power, with real household disposable incomes having fallen for three months in a row, leaving them well below where the pre‑Covid trend would suggest.
The chart below shows RHDI is at its lowest level since February 2025. This is the primary driver of consumer spending power – otherwise you need to start selling assets or save less in order to generate spending growth. And guess what has happened – the household saving ratio has dropped to just 2.6% from 3.2% in March and is well below the 6% long run average. This is something that needs to be closely watched and will only reinforce the K-shaped narrative of higher income households continuing to spend, boosted by wealth gains, while lower and middle income households come under increasing financial pressure.
Real Household Disposable Income (2017 $bn)
Rounding out the numbers, durable orders got a huge lift from strong Boeing aircraft orders (136 jets in April versus 33 in March), but the key metric to focus on is non-defense capital goods orders ex aircraft, due to the strong relationship with business capex. These orders fell 1.1% versus expectations of a 0.4% rise, although the forecasts had looked overly optimistic given the tech-led 3.9% MoM surge in March. Finally, initial jobless claims came in at 215k with continuing claims at 1786k, broadly in line with expectations.
The combination of softer inflation and weaker growth has seen a muted reaction, with Treasury yields 3-4bp lower across the curve, but Middle East headlines continue to drive the narrative with the data taking a back seat at the moment.
Content Disclaimer
This publication has been prepared by ING solely for information purposes irrespective of a particular user's means, financial situation or investment objectives. The information does not constitute investment recommendation, and nor is it investment, legal or tax advice or an offer or solicitation to purchase or sell any financial instrument.Read more