World trade heading for the worst year since 2009
The strong setback to world trade growth at the end of 2018 and the damage from the trade war will make 2019 the worst year for trade since the financial crisis, with only 0.4% growth. 2020 is likely to show growth around 2%, but that improvement could vanish if the trade war drags on in 2020
Uphill battle
The outlook and this article were updated on Monday the 10th of June to include the effects of the US - Mexico migration deal.
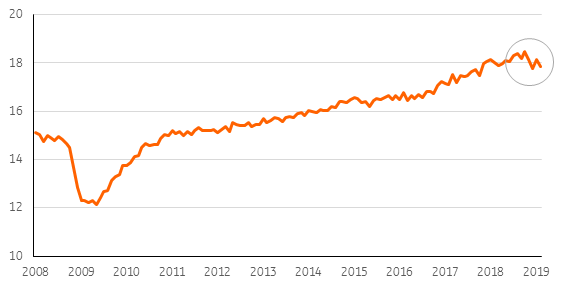
World trade is fighting an uphill battle in 2019. During the last two months of 2018, global trade levels dropped more than 3%. An economic setback in the world’s largest (trading) economies and plunging confidence among investors led to the largest fall in trade volumes since the global financial crisis.
A rough start for world trade in 2019
World trade volumes in 2010 USD (trillion)

Trade will adjust
The latest data shows that the volume of world trade in March was still lower than average trade levels in 2018. This means that global trade volumes still have quite some catching up to do in 2019 before the year to date volumes match those of last year. This feeding through of the setback in late 2018 strongly limits the upward potential of trade growth this year.
1Q19 has shown better than expected economic growth in the US, the eurozone and China, but so far this has hardly translated into higher growth for world trade. However, we expect trade levels to adjust to higher levels of GDP and industrial production. The growth of industrial production has been negative in some parts of the world during the first few months of this year but not everywhere. Global industrial production has been well above 2018 levels, indicating that there is ample room for trade to do some catching up.
March showed the first step in that direction and time charter shipping rates suggest that this continued in April and May. After the catch-up process is completed, we expect the economic cycle to support trade volumes in a way that would result in 'normal' (five year average) month on month growth rates. This would result in trade growth of 1.2% in 2019.
However, if we consider the ongoing negative effects of the US-China tariff hikes in 2018, the effect of the latest tariff hike by the US and the retaliation from China, trade growth will come down to 0.6%, assuming a status quo for the rest of the year regarding the trade war.
We expect the upward influence of the economic cycle on trade in 2020 to be roughly the same as in 2019, which would result in world trade growing by 1.7% next year. Taking into account the feeding through of the tariff hikes of 2019, trade growth would be 1.6% in 2020.
Trump will hike tariffs again if trade partners don’t give in to his demands
But, what is likely to happen next in the ongoing tit-for-tat trade war? Additional tariff hikes on US imports from China and imports from other trade partners, like Japan and the EU, are a serious possibility, given recent events.
It is hard to forecast how the trade war will play out exactly. We present three scenarios and attribute a somewhat higher probability to scenario 2 than 1 and 3.
Container ship rental prices bottoming out
Index, October 2018 = 100

Trade war in 2019 and 2020
After a couple of months in which the trade conflict appeared to de-escalate, tensions fired up again in early May this year. President Trump's decision to hike tariffs on the $200 billion package of goods, his threat to extend higher tariffs to all US imports from China, and the retaliation and tougher public stance of China, have all unnerved the financial markets. The boycott of Huawei, postponed or not, could turn the trade war into a broad business war with China.
Last week, Trump added a whole new chapter in his attack on free trade by announcing import tariffs on all imports from Mexico if the country does not curb the flow of immigrants to the US. The President threated to impose a 5% tariff this month and to increase the pressure by raising it with monthly increments of 5% to 25% in October. These tariffs seem off the table for now, since a deal between the US and Mexico has now been reached.
By scrapping the tariffs on steel and aluminium for Canada and Mexico to get his deal through Congress, President Trump has shown that he is willing to compromise. And the fact that the President decided to postpone the decision about higher import tariffs on cars by six months shows that he is open to negotiation.
At the same time, the US administration has made clear that, during these six months, it expects car exporting countries to agree on measures that will diminish their car exports to the US. As such, the US is still using the (threat of) tariffs to steer the EU, and other car exporters like Japan, into making concessions. So, while things are calm for now on this front, the risk of the US-EU and US-Japan trade conflict escalating has not subsided.
This all fits into Trump's overarching strategy of trying to strong-arm trading partners to give the US better terms of trade.
Recent events show that there is a good chance President Trump will deploy his favourite policy tool again this year or next if China, the EU or Japan, don’t give in (fast) enough to his demands. Although the President has said that the stock market is the barometer of his policy success, the negative response of the equity market to his decision to hike tariffs on Chinese imports did not stop him from deploying this weapon again last week. This indicates that President Trump is prioritising his top campaign promises, like getting better terms of trade for the US and reducing the inflow of illegal immigrants.
For calculating the effect on world trade in 2019 and 2020 of future developments in the trade war we take the second scenario. This suggests trade will grow no more than 0.4% in 2019 - the worst year since the great collapse of trade in 2009- and 2.2% trade growth in 2020.
Currently risks seem to be tilted to the downside. However, it wouldn't surprise us if President Trump would once again change his tone of voice, because he likes to play the game of 'blowing hot and cold'. That could lead to a more positive negotiation climate which would enhance cutting deals. After all, Trump plays tough but in the end he cannot afford to fail in negotiating better trade deals for the US.
Scenario 1: Deals with China, the EU and Japan without further tariff hikes
One possibility is that the recent tariff hikes and threats of (further) hikes by President Trump are enough to force China, the EU and Japan to enter into a deal with the US before the presidential elections in November 2020. Although the US administration's decision to raise tariffs to 25% on the $200 billion package of Chinese imports has tainted the friendly negotiating climate to strike a deal, the economic damage caused by the hikes and the prospect of increasing damage if Trump carries out his threat to impose tariffs on all Chinese goods, is an incentive for China to make a few more concessions.
In this scenario, Trump considers the disadvantages of tariff hikes more so than he has done so far. Until now, he has emphasised that tariffs create jobs in industries like steel and aluminium and that tariff income is pouring in. But after the latest retaliatory tariffs from China, US industries and consumers will increasingly be hit by higher prices. Add to this that patience is running thin in the agriculture sector and other industries hit by retaliation, and the President may find himself under pressure to water down his demands and end the trade conflict.
In this scenario we expect the US to strike a deal with China by the end of 3Q19, scrapping half of the current tariffs immediately and a gradual phasing out of the remaining tariffs in 2020, provided that both sides live up to the agreement.
It’s hard to gauge the exact content of the agreement but it's probable that China will at least agree to import $70 billion more of American goods and commodities on an annual basis since they offered to do this at an earlier stage of negotiation. In this scenario, the deal also contains agreements about majority shareholdings of foreigners in Chinese companies and/ or joint ventures, better protection of intellectual property and concrete steps by the Chinese government to prevent forced technology transfers from Western companies in joint ventures.
The concession of the US administration in this scenario could consist of no longer insisting that China let go of its ambition to be a world leader in certain tech markets.
This scenario of a relative quick ending of the trade war would limit the trade damage to 0.5% this year, resulting in world trade growing by 0.7% in 2019. The effect of the undoing of the imposed tariff hikes accelerates in 2020, which has a positive influence on trade of 1.0%. In this scenario trade growth would be 2.7% in 2020.
Timeline scenario 1

In this scenario, we think no car tariffs will be applied. The US strikes a trade agreement with Japan in the course of 4Q19. The US and the EU will strike a deal as well but it will take until the end of 1Q20 because the negotiations between the US and EU are lagging.
A deal on cars will be part of these agreements, probably by bringing EU import tariffs (10%) in line with the American ones (2.5%) over the course of probably three to five years. The US, in return, will reduce its import tariffs on pick up trucks (currently 25%) to EU levels.
A deal on cars with Japan will have to take the form of quantity restrictions to Japanese exports because import tariffs in Japan are currently not higher than the American (actually lower).
The US will, in this scenario, water down its agricultural demands and settle for a mutually executed study that looks into possible reforms of the Japanese and EU agricultural sector.
The positive of the agreements for both Japan and the EU will be that, as part of the deal, non-tariff barriers for industrial goods will be brought down by all parties. This increases the possibility to export to the US in the medium term. In this scenario, we assume that half of the non-tariff barriers for the $220 billion trade between the US and Japan, will be lifted, which increases both US and Japanese exports by $2.8 billion. This compensates Japan almost fully for the $3.1 billion reduction of its auto exports to the US, which is the consequence of a deal on cars similar to that struck between the US and Japan in the 1980s when Japan agreed to ‘voluntarily’ restrain car exports to the US by 7.5%. The US, and world trade will have a net gain of $2.8 billion because of its benefits from taking down half of the non-tariff barriers without having to lower its auto exports to Japan.
For world trade, the net gain is negligible but taking down half of the non-tariff barriers for US-EU trade delivers a gain of 0.1% for world trade, of which three quarters will materialise in 2020, bringing the gain for world trade of all the trade agreements in this scenario to 1% in 2020 (see table).
Trade war threatens to squash trade recovery in 2020
Scenario 2: Deals with China, EU and Japan after new tariff hikes
In this scenario, things get worse before they get better. China will initially stick to its current tougher (public) stance to show that it won't be bullied by President Trump. Only after the US imposes tariffs on all Chinese goods in 3Q and China retaliates- among other things by making it difficult for US firms to do business in China (border procedures, slower granting of permits, black listing, etc)- will both parties fully realise the consequences of this trade war.
It will take some words of reconciliation from President Trump and a willingness to attenuate some of his most far-reaching demands for the Chinese to be prepared to give in a bit more so that a deal can be struck. By saying recently that there is a “good possibility” of a deal, the President has made a start.
The content of the deal could be similar to what we've described in our first scenario, but we would probably have to wait, until the end of the year (4Q 2019) before a scenario like this ends up in a deal.
Timeline scenario 2

This scenario is also characterised by tariff hikes on US automotive imports from the EU and Japan before the US strikes deals with the EU and Japan. The trade conflict with the US will escalate first because, in this scenario, both the EU and Japan are likely to object to President Trump's condition that negotiations have to result in a net gain for the US. Moreover, the President's demand to bring the agriculture sector to the negotiation table will block a deal because opening up the agricultural markets is a very sensitive issue in Europe and Japan and at odds with the negotiating agenda that President Trump agreed with Jean-Claude Juncker last summer.
In this scenario, it will take until the end of 1Q before Trump secures a deal with Japan and one quarter longer to strike a deal with the EU.
The further escalation of the trade war leads to a larger impact on world trade growth in 2019 (-0.8%), meaning that world trade would only grow by a meagre 0.4%. There is some feeding through of this into the first part of 2020 but this is eventually overtaken by the positive effects of the unwinding of all the tariff hikes after the deals are struck, leading to a net positive effect on trade of 0.5% in 2020. This would bring world trade growth to 2.2% in 2020.
Scenario 3: Escalation without results: no deals with China, EU and Japan
In this scenario, it takes one quarter more for Mexico to come to an understanding about curbing the flow of illegal immigrants into the US.
The US steps up the trade war against China by applying the 25% tariff hike to all goods and escalates the trade conflict with the EU and Japan, too. These trade partners refuse to enter into a deal that is characterised by too few concessions from the US to compensate them for opening their agricultural markets. In this scenario, US import tariffs on cars will be hiked by 20 percentage points at the end of the six month delay period (mid-November), despite significant resistance within the US against the escalation of the conflict with traditional allies like the EU.
By holding trade partners at gunpoint repeatedly, Trump risks they get fed up and leave the negotiation table
Timeline scenario 3

In this scenario, the EU and Japan will retaliate in kind and China will respond as described in the second scenario. President Trump will react to this by levying a tariff hike of 10% on half of the other imports from Japan and the EU, followed again by retaliation in kind. No deal will be struck before the US elections in November 2020.
In 2019 the impact on world trade will be a bit worse because the conflict with China will be prolonged for another quarter. In 2020, scenario 3 continues to hit trade because tariff hikes, will bite more than in 2019. So we're likely to see a negative effect in 2020 of 1.1 percentage point on world trade in this most negative scenario.
In this scenario trade growth will be only 0.6% - almost five times less than in our first scenario where the trade war ends quickly.
World trade growth 2019 and 2020

This publication has been prepared by ING solely for information purposes irrespective of a particular user's means, financial situation or investment objectives. The information does not constitute investment recommendation, and nor is it investment, legal or tax advice or an offer or solicitation to purchase or sell any financial instrument. Read more
Download
Download article
10 June 2019
What’s happening in Australia and the rest of the world? This bundle contains 8 Articles
