US yield curve and recession risk - watch the shape not the slope
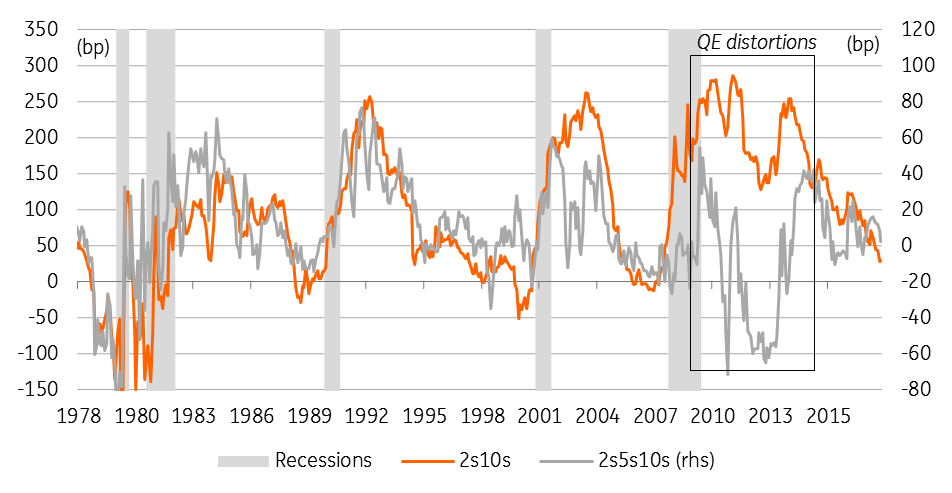
With the 2s10s yield curve on a persistent flattening trend and dipping below 25bp last month, talk about a possible downturn in 2H19/2020 has heated up. We don't think the US curve will invert anytime soon but when it does in 2019 keep an eye on 2s5s10s - the alternative bond market recession indicator
As we expect US 10-year Treasury yields to break back above 3% later this year, the 2s10s curve shouldn't invert anytime soon. When the curve does invert, possibly around mid-2019, a recession may not necessarily be around the corner, as the curve circumstances seem to resemble 2005/2006, when the term premium embedded in longer-dated yields was also very low. However, the message from a flat/inverted curve shouldn't be ignored, as it could hurt banks and the process of credit creation, potentially making an economic downturn self-fulfilling.
Ironically, if the Federal Reserve were to take it seriously and become reluctant to hike rates further – unlike in 1H06 when they hiked rates a further four times – it might reduce the likelihood of a near-term recession, as monetary policy probably wouldn’t turn really restrictive. We closely watch the 2s5s10s (butterfly) valuations and Leading Economic Index to asses when a recession becomes truly imminent.

The ‘R’ word is making inroads as 2s10s flattens relentlessly
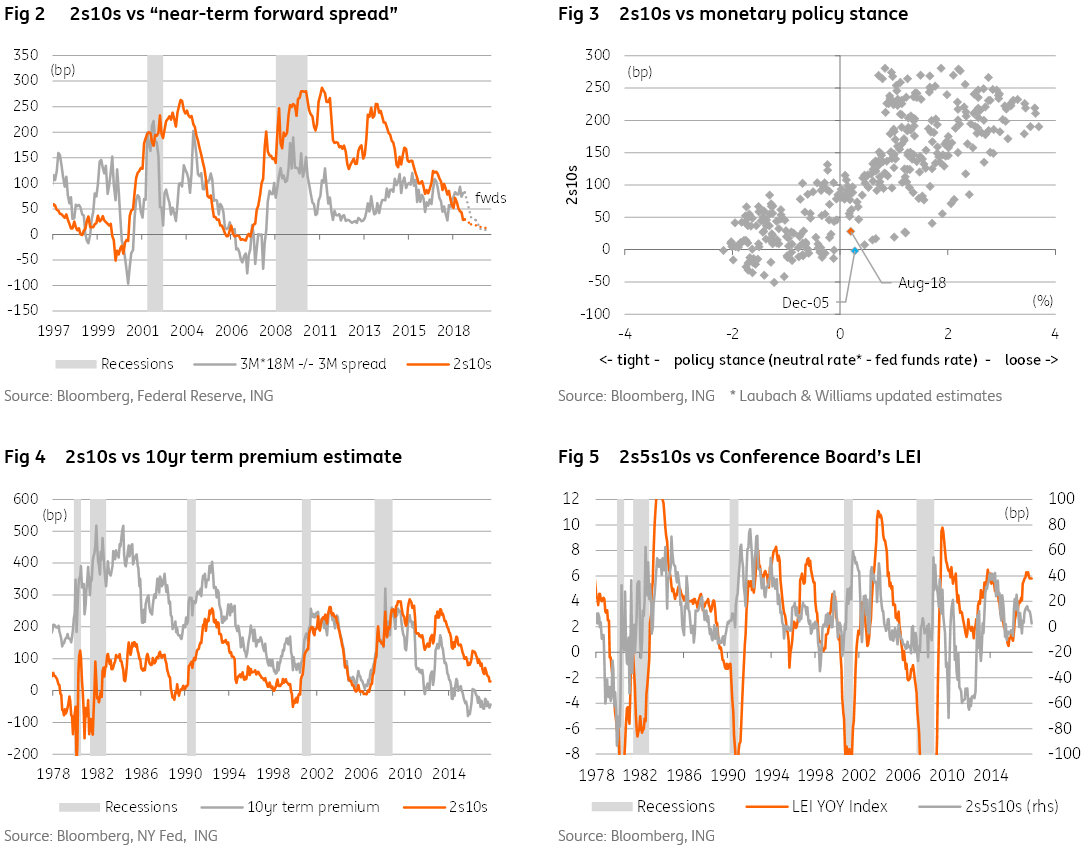
Although lags can be long and variable, historically an inverted yield curve has been regarded as one of the best indicators of an impending recession in the US. With the 2s10s yield curve on a persistent flattening trend and dipping below 25bp last month, talk about a possible downturn in 2H19/2020 - when the effect of the fiscal stimulus will wear off - has heated up. The Fed has also interfered in the debate, recently arguing that market participants shouldn't fear the yield curve and start to look at a “near-term forward spread” (i.e. the spread between the 3-month rate six quarters forward and the 3-month spot rate), which doesn't indicate an elevated likelihood of recession as seen in figure 2.
Moreover, as our economists have highlighted, the yield curve inversion does not make a recession inevitable, and there are reasons to believe the yield curve may be artificially depressed.
Is this time different?
Indeed, with the US 10-year rate dampened by ongoing albeit slowing, net quantitative easing in Japan and the Eurozone – by around 40 basis points on our estimates at the moment – the 2s10s curve may be flatter than it otherwise would have been. This is confirmed when comparing it to the stance of US monetary policy as measured by the difference between the real neutral rate and the real Fed funds rate: as policy is still somewhat accommodative, the curve should be some 30-50bp steeper than it currently is (Figure 3).
An alternative way of arriving at this conclusion is by looking at the subdued estimates of the term premium embedded in 10-year yields (Figure 4). Note that at the end of 2005, when the term premium was also low, the curve was even more out of whack with the policy stance. This helps explain why the Fed implemented a further four 25bp rate hikes in 1H06, after which it stopped its tightening cycle. In hindsight, though, the warning from the yield curve did not prove to be a false alarm. In this regard, we wonder whether a prolonged period of curve inversion, through the effect on (smaller) banks and credit creation, can potentially make a recession self-fulfilling.
2s5s10s – an alternative ‘recession indicator’
Rather than adjusting the term premium, as the Fed has done in an earlier paper, we prefer to rely on another market indicator to gauge the recession risk – the 2s5s10s (butterfly) valuation, which basically captures the shape of the 2s10s yield curve. When 5-year is high relative to 2-year and 10-year yields, the curve is humped-shaped, and the 2s5s10s is high. For example, when 5-year yields are ‘relatively’ low, because markets price in a rate cutting cycle, 2s5s10s is low. Ignoring 2008-2014, when 2s5s10s was distorted because of the Fed’s net QE policies, we find that a gross 2s5s10s valuation (long the belly, short the wings) of -20bp or lower historically entails a large risk of an impending recession.
To be sure, as the 2s5s10s (like the 2s10s) gave a wrong signal during the Asia crisis in 1998, we would also look – as a double check - at the Conference Board’s Leading Economic Index (LEI), which tends to drop below 0% YoY ahead of an impending recession. Encouragingly, both the 2s5s10s valuation and LEI, albeit having eased, haven't set off alarm bells yet (Figure 5).

Download
Download article10 August 2018
In case you missed it: Emerging markets in turmoil This bundle contains {bundle_entries}{/bundle_entries} articlesThis publication has been prepared by ING solely for information purposes irrespective of a particular user's means, financial situation or investment objectives. The information does not constitute investment recommendation, and nor is it investment, legal or tax advice or an offer or solicitation to purchase or sell any financial instrument. Read more


