The Russia-Ukraine crisis: The market reaction so far
Russia's recognition of the Donetsk and Lugansk People's Republics (DLPR) has sparked global outrage and triggered the first tranche of sanctions. Although Russian markets are closed for a public holiday, offshore trading shows a continued sell-off in Russian USD debt. We take a look at the cross-market reaction to the latest developments in Ukraine
Russia makes its move, the world responds with sanctions
This week, Russia recognised the sovereignty of Donetsk and Lugansk People’s Republics (DLPR), two breakaway territories in Eastern Ukraine, and signed treaties on social, economic, and military cooperation. Those treaties allow the Russian military to enter those republics and act in case of an 'external military threat'. DLPR has territorial claims over the enlarged Donetsk and Luhansk regions of Ukraine, but Russia indicated that it hopes for a diplomatic resolution. So far, there have been no confirmed cases of direct military contact between the Russian and Ukrainian military, but there are OSCE reports of numerous ceasefire violations alongside the borders of DLPR and Ukraine-controlled territory.
With the exception of a few countries which joined Russia in recognition of DLPR (Cuba, Nicaragua, Syria, Venezuela) the global response was largely negative. The US, EU, UK, and Canada reacted by jointly widening the sanction regime. Most importantly, the Nord Stream 2 gas pipeline project was frozen until further notice, foreign participation in Russia’s sovereign debt issued after 1 March was banned, Russia’s two financial institutions, State Corporation Vnesheconombank (VEB) and Promsvyazbank were slapped with blocking financial sanctions (cut off from FX transactions and asset freeze), and the same was applied to a number of high ranking individuals. Perhaps more importantly, US president Biden indicated that the announced measures are just the first tranche.
As a reminder, the US Congress is mulling a bill that prescribes blocking sanctions for up to 12 Russian financial institutions in case of further escalation, at the US administration’s discretion. According to our estimates, 9 out of 12 institutions on the list account for 70% of the Russian banks’ FX balance sheet, but the individual size varies from as little as $1bn to as much as $100bn. The remaining 3 (including VEB and PSB) do not disclose their FX balance sheets but they're unlikely to be large.
Russian asset markets: Continued deterioration
Wednesday’s Russian public holiday makes the impact of the latest round of sanctions a little hard to decipher, but offshore trading points to a further round of weakness. There has been no trading of local currency OFZ Russian sovereign bonds today, but the more liquid 2047 USD Eurobond has sold off further, with yields another 50bp higher near 6.00%. In light of new prohibitions to trade Russian sovereign bonds in the secondary market, for new debt issued from March 1st onwards, investors will watch carefully for the performance of OFZs when they re-open tomorrow. Prior to the sovereign debt sanction announcement, non-residents held RUB2.8 tr ($35.3 bn), or around 18% of the overall OFZ market. Russia is now experiencing the fifth consecutive month of foreign portfolio outflows from OFZ. In October-January it totalled $5.4bn, and since the beginning of February, some $1.1bn were withdrawn.
The rouble initially took the new sanctions in its stride but remains vulnerable
The rouble initially took the new sanctions in its stride but remains vulnerable. In focus for the FX market will be the issue of whether counter-party risk considerations start to show up in Russian FX swap curves. Back in 2014/15, concerns over counterparty risk (on the back of sanctions) led to the brief development of an onshore and an offshore FX swap curve, where offshore RUB implied yields were briefly quoted 20% wider than those onshore. For a deliverable currency, such as the rouble, there should only be one FX swap curve. Currently, one month offshore RUB implied yields are trading at 13.6%, just modestly wider than onshore at 13.2%. Any fears of broader sanctions could see this spread widen further.
FX Markets: Pricing a benign outcome
It seems fair to say that FX markets continue to price more benign outcomes. President Putin’s recognition of new autonomous zones and the crossing of Russian military into the Donbas region was greeted with a decline in FX option market traded volatility. For example, one month traded volatility prices for both EUR/USD and USD/JPY have fallen around 1% to 6.5% over the last 36 hours. One can only assume that the broader FX market believes this will be the extent of the Russian incursion.
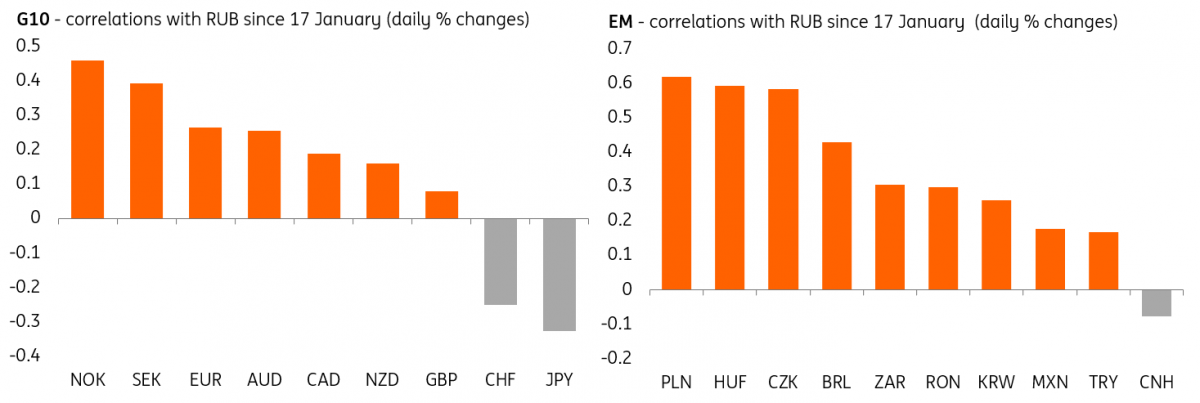
Understandably, the relative performance of FX has been a function of geographical proximity and dependence on energy imports (although the Japanese yen has outperformed here.) As highlighted with correlations to daily changes in USD/RUB below, we would expect the currencies of Norway and Sweden and of course the CE3 to continue to trade on a fragile footing – and our preference remains for the dollar through this current crisis.
Daily FX correlation with the RUB since mid January
Developed Rates: Spot the difference
When compared to their rise since last summer, the reaction of traded interest rates to the current crisis has been muted. For instance, 10Y Treasury yields, for many the first port of call for safe-haven flows, are only 7.5bp below their peak. There are two complementary explanations for this. First, it is possible that market participants have taken a sanguine view on the impact of the recent escalation on the performance of DM risk assets and on growth. Second, the safe-haven flow is dented by the prospect of a further rise in yields justified by sticky inflation and tightening central banks.
10 year developed market yields correct lower

Only time will tell if the first assumption is correct. The second is easier to assess. The impact of energy prices on inflation should be offset in the market’s mind by the detrimental effect on confidence. In theory, that effect should be stronger on the European rates curve than on their American counterparts. The threat of inflation also points at a curve flattening bias if the situation worsens. At the very least, this argues for caution and justifies a pause in the rise in yields. The proximity of the flurry of March central bank meetings is another reason to expect rates to trade without much direction, provided no further escalation.
Credit is more volatile since ECB meeting – spreads widen
EUR spreads widened by roughly 5bp yesterday on the back of the Russia-Ukraine news, while USD spreads widened by just 1-2bp. Although, due to the ECB likely stopping CSPP support earlier than expected, and subsequent outflows in mutual funds, EUR credit is left less supported and thus more volatile.
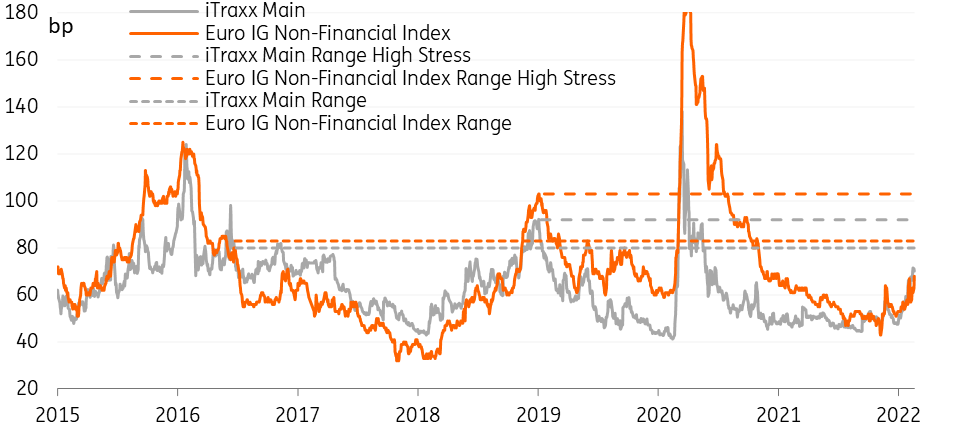
We still feel spreads are now heading into oversold territory
We still feel spreads are now heading into oversold territory and could potentially approach the wide spreads seen in mid-2016 and mid-2019. When compared to both mid-2016 and mid-2019, we determine a new high end of the range to be 80bp for the iTraxx main (now at 70bp) and 83bp for the ICE BofA Euro non-financial index (now at 68bp) although, in a more stressed environment, spreads could reach levels last seen in early 2019. USD spreads reacted less off the news, but have been consistently seeing a slow widening over the past months, underperforming EUR spreads.
European credit spreads continue to widen
Credit curves have been flattening slightly. The 1-3yr area of the curve is still looking rather expensive versus swaps, while the flattening is seen on the long end rebounding slightly. We still prefer the belly of the curve for now. The Industrials sector and the Oil & Gas sector underperform on the back of the Russia-Ukraine news, with widening of 6bp and 8bp respectively. For the Oil &Gas sector, higher energy prices provide no solace for credit spreads. Real Estate has also been under pressure from supply, as this is becoming a high beta new sector. Meanwhile, the TMT sector has been rather stable. Please read our report Credit Overshoots for more information on positioning.
European gas rallies on Nord Stream 2 decision
Commodities have been pricing in a fairly large risk premium as tensions between Russia and Ukraine escalate. This is not a surprise, given the powerhouse that Russia is when it comes to commodities. This is particularly the case for crude oil, natural gas, palladium, platinum, nickel, aluminium and wheat. The concern has been that any sanctions from the West could potentially disrupt export flows of these commodities, at a time when a number of these markets are already tight and trading near multi-year highs.
However, sanctions announced so far should have little to no impact on most of these key commodities. Therefore, it is not surprising that we have seen oil and some metal markets (aluminium and nickel) trading lower from their recent highs. But, given that there is still plenty of uncertainty over how the situation will evolve, we would expect markets to continue to price in a fairly large risk premium, particularly given that the current tightness in a number of these markets leaves them more vulnerable to supply shocks.
The move in the European natural gas market has stood out, with the market rallying after Germany decided to suspend the approval process for the Nord Stream 2 pipeline. The pipeline is not operational and so should not directly impact flows. However, the market had been expecting that when the pipeline became operational, Russia would increase flows once again and help ease the tightness in the European market. Instead, the market could potentially tighten further, leaving Europe in a vulnerable position for another heating season. Concerns over continued tightness in the gas market are reflected in the TTF forward curve, with it trading above EUR80/MWh through until February 2023.
This publication has been prepared by ING solely for information purposes irrespective of a particular user's means, financial situation or investment objectives. The information does not constitute investment recommendation, and nor is it investment, legal or tax advice or an offer or solicitation to purchase or sell any financial instrument. Read more
Download
Download article