US yield curve: Self-fulfilling prophecy?
- 9 August 2018
- United States
Like everyone else, the Fed is watching the yield curve for signs of the next recession. But it seems unsure on what signal to take from the flattening curve

The yield curve tells us about recession risk
The US economic expansion is now into its ninth year, the second-longest on record. So even as growth is hitting new heights, it’s little wonder there is more and more anxiety about when the next recession might come along. In particular, the US yield curve has been under increasing scrutiny. When short-term rates rise above long-term rates and the curve inverts - a recession usually follows. This is why the inverted yield curve is one of the most widely followed early warning indicators.
The yield curve’s predictive power is generally believed to be derived from the way the curve captures investor’s beliefs about the outlook for the economy. When the economy is expected to do poorly, investors prefer to lock in safe returns, which pushes long-term yields down relative to short-term yields, causing the curve to flatten and eventually invert.
If the Fed sees inversion as a reliable precursor of weaker growth, especially if it coincides with other signs of slowing growth, then an inverted curve could lead to slower hikes, or even a pause
But there is also an element of self-fulfilling prophecy going on here. If near-term yields are close to or higher than long-term ones, then banks and investors are incentivised to keep cash in relatively high-yielding short-term bonds rather than lend or invest in new projects which hampers economic growth in the near term. To the extent that markets take a flattening or inverted yield curve as a sign of trouble ahead, risk-aversion reinforces the adverse effect on the economy.
And it is flattening fast
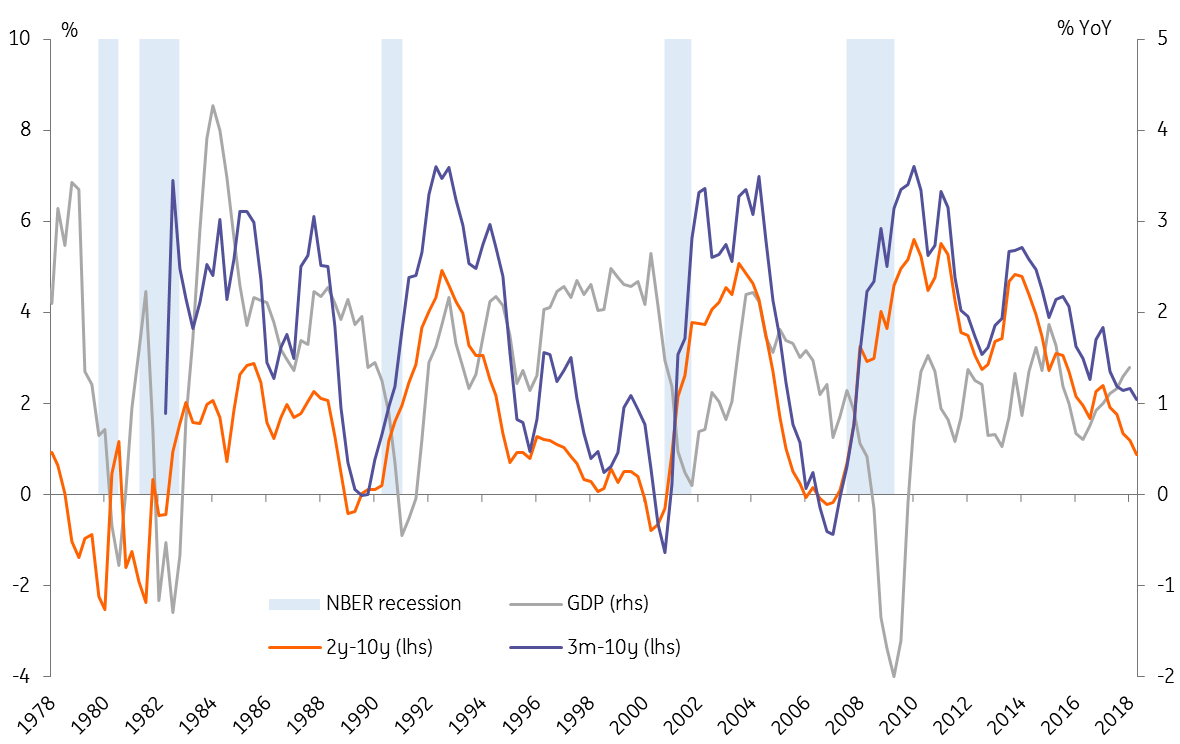
The most commonly cited measure of yield curve inversion is probably the yield on a 10-year treasury bond minus that on a 2-year treasury bond. This relationship has turned negative ahead of each of the past nine recessions going back to the 1960s. Even when yield curve inversion turns out to be a ‘false positive,’ as in 1998, a flat or inverted yield curve typically coincides with a material slowdown in growth and a pause in the Fed’s rate hike cycle.
The 3m-10yr curve, which Fed Governor Lael Brainard recently cited, follows a similar pattern to the 2yr-10yr tends to invert closer to the start of a recession and has only produced one ‘false positive’ reading, back in the 1960s.
On both these measures, the US yield curve has flattened significantly over recent years. The 2y-10y curve is now just 29bps (vs. 51bps at the start of 2018), and the 3m-10y curve is at 93bps (from 101bps at the start of the year). History suggests this indicates a recession is more likely, though a downturn is probably not imminent just yet.
US yield curve inversion; measured by 2yr-10yr and 3m-10yr
But does the Fed believe it's different this time?
Fed officials have started to discuss the yield curve in recent speeches and the minutes of the FOMC’s June meeting show that some are now questioning the reliability of the yield curve as an early warning signal.
“Participants pointed to a number of factors, other than the gradual rise of the federal funds rate, that could contribute to a reduction in the spread between long-term and short-term Treasury yields, including a reduction in investors’ estimates of the longer-run neutral real interest rate; lower longer-term inflation expectations; or a lower level of term premiums in recent years relative to historical experience reflecting, in part, central bank asset purchases.”
In short, some Fed governors appear to argue that yields on longer-term bonds, like the 10-year, are held down by a set of factors that either weren't present or were less important in previous economic cycles. That means the spread between short term and long term bonds will tend to be smaller than the past, and therefore may not have the same predictive value.
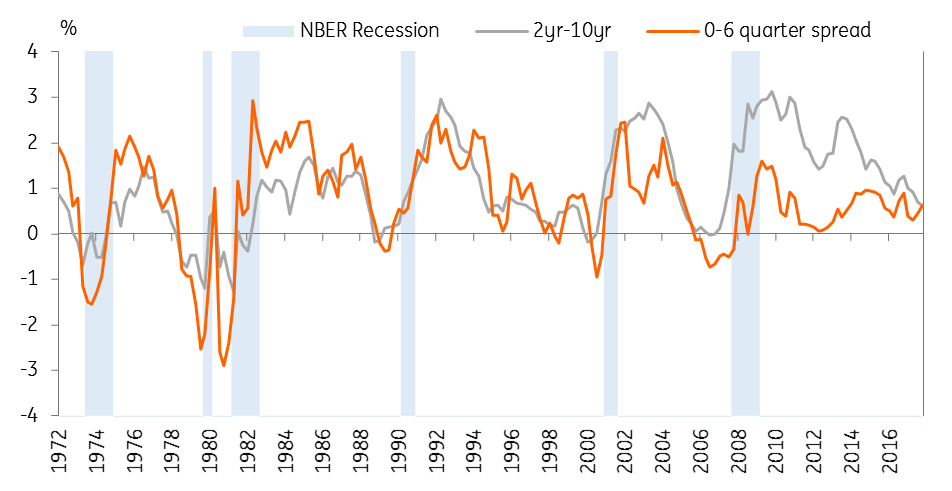
The minutes also show the Fed is looking at alternative measures that are less affected by term premia. Fed staff recently published a comparison of the predictive power of different measures of the yield curve. This research indicates that a shorter term curve comparing the current 3-month T-bill rate with the implied forward rate (on T-bills) six quarters ahead is a better predictor of an upcoming recession than longer tenor measures such as the 2yr-10yr.
Our rates strategists also argue that the 2yr5yr10 (butterfly) measure, which measures the shape of the curve across the short, medium and long-term tenors, is an accurate and more timely recession indicator, though it is also susceptible to quantitative easing distortions.
Both the measure favoured by Fed staffers and the butterfly measure favoured by our rates strategists have historically moved closely with the 2yr-10yr until 2008. In contrast to the 2yr-10yr and 3m-10yr measures, the shorter term curve has not flattened much in recent years and is broadly unchanged in 2018. If this is the better measure of recession probability, then there is less cause for concern about the growth outlook.
The Fed’s shorter term yield curve measure compared to the 2yr-10yr curve
So what does this mean for Fed policy?
How the FOMC interprets the yield curve could make a big difference to the policy outlook.
If policymakers think a flat 2yr-10yr curve is less worrying than history suggests and chose to focus on the shorter curve, they are more likely to keep hiking rates even if the longer curve inverts. If they see inversion as a reliable precursor for weaker growth then an inverted curve, especially if it coincides with other signs of slowing growth, could lead to slower hikes, or even a pause.
It’s not clear where the balance of the committee sits on this question Chairman Powell downplayed the importance of the yield curve in his recent testimony to Congress. But perma-dove Neel Kashkari has argued that the flat yield curve is another reason why he prefers fewer rate hikes than the FOMC’s current plan, and a number of other rate-setters have also voiced concerns about how markets would react to an inverted yield curve.
The FOMC will be mindful that a similar debate played out towards the end of the last rate hike cycle in 2005-06. The yield curve then inverted and the Fed kept hiking and a recession followed by the end of 2007.
For now, the question remains a hypothetical one. Even on the 2yr-10yr measure, the curve is still some way from inverting and if we are right in thinking 10-year yields are likely to push back above 3% then the curve should remain positive for some time yet.
Meanwhile, the US economy is firing on all cylinders: unemployment is near record lows, GDP growth on track for 3% or more this year, and inflation is above target. That means the case for the Fed to keep gradually raising rates remains strong. And while the Fed will continue to keep an eye on the yield curve, as long as economic fundamentals remain solid we think the FOMC is unlikely to change course.
Content Disclaimer
This publication has been prepared by ING solely for information purposes irrespective of a particular user's means, financial situation or investment objectives. The information does not constitute investment recommendation, and nor is it investment, legal or tax advice or an offer or solicitation to purchase or sell any financial instrument.Read more
Included in the following bundle
In case you missed it: Emerging markets in turmoil
- This bundle contains 7 Articles