JPY: Why the yen’s at a crossroads
- 11 July 2018
- FX Japan
We see two potentially large and opposing drivers of USD/JPY over the next six months. Further Fed tightening and US Treasury curve flattening look positive. A substantial escalation in the trade war looks negative; volatility looks to be too low


Bearish flattening of the US Treasury curve helping USD/JPY
Despite all the concerns of an escalating trade war, the world’s favourite safe haven currency – the Japanese Yen (JPY) – is drifting towards its lowest levels of the year against the US dollar (USD). The rise in USD/JPY over 111 probably owes to firm US yields at a time when US equities are remaining bid. Here the US$1.5trn in US tax cuts have likely delivered insulation for US equity markets.
Assuming US equities do not crash this summer, the current bias is for US yields to push higher this summer
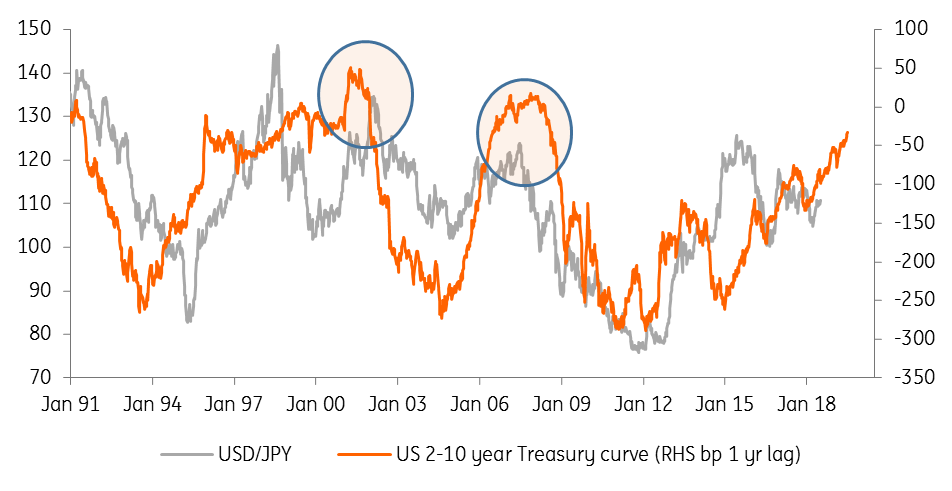
Typically a flattening in the US Treasury curve has proved bullish for USD/JPY. Here, the typically held view is that the relative rise in short-end US rates relative to the long end makes dollar hedging costs disproportionately expensive. Japanese investors, therefore, reduce their rolling three-month dollar hedges, leading to dollar demand. For reference, it currently costs Japanese investors 2.6% annualised to hedge their USD exposure back into the JPY using three month forward contracts. That nearly wipes out all of the yield pick-ups of investing in US Treasuries. Assuming US equities do not crash this summer, the current bias is for US yields to push higher this summer as US price pressures stay firm and the balance of risks favour USD/JPY towards 114/115 at this stage.
Flatter US Treasury curve usually helps USD/JPY
Trade war escalation extends into the US Treasury market?
However, those positioning for higher USD/JPY will have to be nimble. As our Chinese economist Iris Pang highlights today, China could start considering alternative routes to retaliate against US trade sanctions, simply because America has more imports on which to place tariffs than China. One of these qualitative threats from Chinese authorities is that of diversifying away from its large (US$1 trillion+) worth of US Treasury holdings (probably towards European debt markets).
Clearly, it would take much provocation for the Chinese to undertake this act of economic self-harm – since the result would be to devalue both the asset and the currency which comprise the largest share of its foreign exchange reserves. Viraj Patel addressed this issue earlier in the year. Any early signs of the Chinese losing interest in US Treasuries could emerge from their participation at US Treasury auctions. Typically foreign central banks hold US Treasuries with a maturity of five years or less. Were the indirect bid (a key metric of foreign participation at US Treasury auctions) to fall dramatically at the next five-year auction (July 25th), the market could take fright.
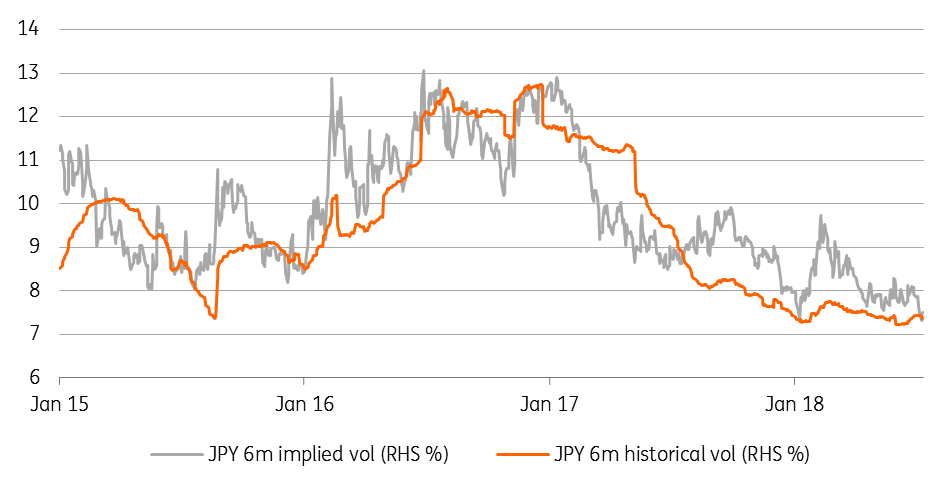
Historical versus traded JPY volatility
Volatility looks too low
A Chinese threat to sell Treasuries is not in our base case but were it to emerge it would prove a major negative for USD/JPY and create the kind of divergence between the dollar and US yields that was briefly seen in February this year and we discussed in Dollar Regime Change.
A Chinese threat to sell Treasuries is not in our base case
So a directional call on USD/JPY is not without its risks! But what seems more clear to us is that volatility looks too low given the risks over the next six months. Six months implied volatility – or the traded price of volatility - is at 7.50%, the lowest since summer 2014 and well before Republican primaries. Six-month historical volatility – or how much spot prices actually rise and fall – are also very low. Notably implied volatility rarely trades below historical volatility at these relatively low absolute levels. The FX options market’s pricing of USD/JPY in a 106-116 range over the next six months looks too conservative in our opinion.
Content Disclaimer
This publication has been prepared by ING solely for information purposes irrespective of a particular user's means, financial situation or investment objectives. The information does not constitute investment recommendation, and nor is it investment, legal or tax advice or an offer or solicitation to purchase or sell any financial instrument.Read more

Included in the following bundle
In case you missed it: The trade war is on
- This bundle contains 6 Articles