European Taxonomy disclosures 2025: Higher ratios, lower comparability
- 27 May
- Financial Institutions Sustainability
The increase in the 2025 average Green Asset Ratio does not signal a meaningful shift towards greener assets, but largely reflects methodological changes introduced under the ESG Omnibus, making this year’s Taxonomy disclosures difficult to compare


2025 was marked by constant discussions surrounding the future of banks’ sustainable disclosure requirements. It culminated in the adoption of the sustainable Omnibus in December 2025. In our publication “ESG Omnibus: Throwing the baby out with the bathwater”, we dived into the changes brought by the first Omnibus and the impact on the European banking sector. The updated regulation brings various and significant changes to both the Corporate Sustainability Reporting Directive (CSRD) and European Taxonomy (EUT) reporting.
A central change brought by the Omnibus is the suspension of mandatory European Taxonomy disclosures for banks over a two-year period, covering the financial years 2025 and 2026. Nonetheless, we ran our yearly analysis of European banks’ sustainability disclosures. Surprisingly, all banks from our sample of 50 institutions from 13 different jurisdictions decided to fully disclose their European Taxonomy templates despite the pause introduced with the ESG Omnibus. This is the result of other regulatory requirements pushing banks to gather ESG data, and the need to align with standards such as the EU Green Bond Standard.
Additionally, we saw an increase in the average Green Asset Ratio (GAR) standing at 7%, a three percentage point rise compared to the FY2024 results. We also note a nearly 20 percentage point YoY increase in Taxonomy eligibility with the average at 55%. One might hope that this comes from the significant growth in banks’ share of green activities, but in reality, it stems from the fast adaptation of the new calculation and methodology brought by the ESG Omnibus.
The updated methodology, among other things, lightens the denominator of the GAR which mathematically lifts results upwards. This not only introduces disparities in banks’ FY2025 sustainable reporting but also affects banks’ GAR differently. Consequently, this year’s Taxonomy disclosures proved nearly impossible to compare. This report dives into banks’ FY2025 reporting and explores the impact the Omnibus has on the results.
Disclosures maintained despite two-year suspension
Despite the ESG Omnibus allowing European banks to skip their Taxonomy reporting for both 2025 and 2026, all institutions included in our sample included full sustainability reporting in their annual report. Two points can explain the continued disclosure.
The first is that the two-year disclosure exemption was announced in the second half of 2025, leaving little time for banks to adapt. Considering that all institutions in scope already have the systems and tools in place to report their Taxonomy templates, using the exemption would have only resulted in limited cost reduction. This is compounded by the lack of alignment between the simplification and other regulatory requirements, such as Pillar 3 disclosures.
Secondly, although still few in number, several banks included in our sample have issued or are planning to issue bonds under the EU Green Bond Standard (EuGBS). Read more on this here. Those institutions are therefore required to ensure that their assets are aligned to the European Taxonomy. Consequently, despite the reporting pause, it is still necessary for these banks to disclose under the European Taxonomy.
Higher GAR biased by the new methodology
Turning to the results, our sample still underlines variations between the GAR disclosed based on the CapEx KPI which lies, on average, slightly higher than the one using Turnover. On the scale of our sample, the Turnover GAR stands at 7% on average while the CapEx one is at 7.2%. While the difference between the two indicators remains stable, we note a three percentage point increase YoY in the average disclosed GAR. This change is due to most banks’ methodology changes, which we will discuss in the next section.
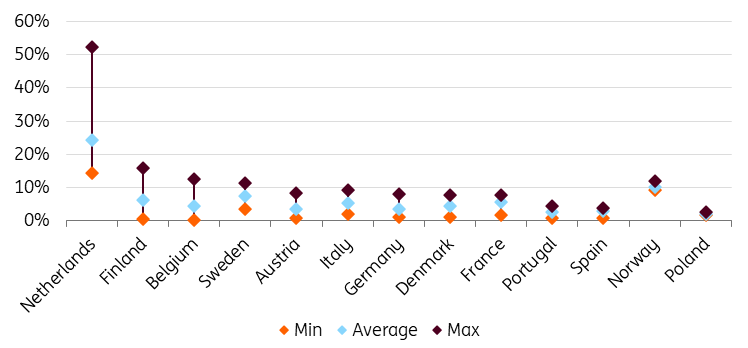
Consistent with the two previous years, the average GAR hides disparities between both banks and countries. Starting with the latter, the Netherlands stood out this year with an average GAR at nearly 25%, up 14 percentage points from last year’s disclosures, due to methodology changes. Norwegian institutions remain second with a GAR at 10% on average, up nearly three percentage points YoY. Swedish, Finnish and French banks follow with a GAR above 5% on average.
Although most jurisdictions saw their GAR increase YoY, the most significant change (aside from the Netherlands) is seen in Sweden (up 3.6 percentage points YoY). The graph below highlights the regional differences, with the Netherlands and Nordic countries disclosing the highest GAR and Portugal and Austria at the bottom of the scale.
Average national Green Asset Ratio disclosed in 2024 vs. 2025

In addition to being an outlier in terms of average Taxonomy alignment, Dutch banks also show the largest difference in results between banks within the country, with a 38 percentage point gap between the highest and lowest disclosed GAR. In both Finland and Belgium, we also note relatively wide variations nationally with a more than 10 percentage points difference. Overall, this year’s disclosures saw growing national reporting differences with an average gap of 9% versus only 4% last year. This mainly stems from a jump in some of the banks’ reported GAR as they have implemented the new methodology.
Green Asset Ratio variation within jurisdictions
Higher results but comparability is lacking
Despite the increase in the average Green Asset Ratio reported in 2025, which may suggest a shift towards greener assets, this year’s Taxonomy disclosures require careful interpretation, as differences in methodology across banks limit comparability.
Indeed, as noted earlier, part of our sample has already adopted the new methodology introduced under Omnibus I. This introduces a materiality threshold, under which activities representing less than 10% of an entity’s net turnover or CapEx KPI are exempt from eligibility and alignment assessment. More importantly, the update excludes exposure to entities outside the scope of sustainable reporting from the GAR denominator. This has a significant impact on reported GAR, as it corrects the asymmetry of the calculation that was bringing results down until the full enforcement of the CSRD scope.
From our sample of 50 banks, 56% have already applied the new methodology to their 2025 disclosures. This includes all Dutch banks, explaining the significant increase in their GAR YoY. Three quarters of German, Finnish, French and Swedish banks have also already reported their Taxonomy using the updated methodology. Out of the 28 banks that have changed methodology, only three provided a comparison to the results they would have obtained by using the initial calculation. Only in Belgium and Portugal did all sampled banks continue using the ‘old’ methodology.
Split of methodologies used for Taxonomy reporting

On average, switching to the new methodology allows financial institutions to increase their YoY GAR results by nearly four percentage points. Part of that increase could be attributed to an actual change in the composition of the bank’s balance sheet. However, when looking at the banks that continued to use the initial Taxonomy methodology, we note that the average GAR increase is only 0.43 percentage points. Therefore, we can conclude that the increase mostly stems from the calculation change.
Dutch banks recorded the largest gain from the Taxonomy update with an average 13 percentage point increase in their GAR YoY. That’s about double what other jurisdictions reported. The differential can be explained by Dutch banks’ diversified portfolios, comprised of both mortgages and corporate lending. When the latter is composed of smaller entities not yet in scope of the CSRD, their exclusion from the denominator through the new method immediately positively affects the results.
Additionally, as the country’s building energy performance scale remains less strict than most of its European counterparts, more buildings are counted as Taxonomy-aligned. The disparity also stems from the regulatory choices for household inclusion. Indeed, using the top 15% most energy-efficient buildings of the national stock and EPC label A, or only one of those criteria, can reflect differently in the results. Therefore, what remains included in the scope of the Taxonomy calculation is, to a greater extent, aligned to the Taxonomy.
Average percentage increase in banks' GAR when using the updated methodology

Beyond the impact of the methodology changes on the GAR results, we also see implications for the Taxonomy eligibility disclosures. In absolute terms, banks maintained rather stable taxonomy eligible asset levels with an average increase below 5% YoY.
However, when looking at Taxonomy eligible assets in relative terms, over covered assets, we note a 17% increase this year on average. This directly stems from the Omnibus update in which banks are not required to include their exposure to entities outside the CSRD scope. Consequently, when looking at the share of eligible assets over those covered in the regulation, results significantly increased. Therefore, while the eligibility rate was an indicator giving a sense of how green a bank’s portfolio could become, the YoY increase can’t be interpreted as such but rather as a mathematical correction of the variable. This divergence once again significantly affects the comparability of results.
YoY change in banks' disclosed Taxonomy eligibility in absolute and relative terms

By plotting the average national eligibility and alignment rate in both 2024 and 2025, the increase in the eligibility rate is clear. Indeed, we note a shift for nearly all countries. That being said, the impact on the alignment ratio varies a lot. Overall, this highlights the changes to this year’s Taxonomy disclosures as well as the associated difficulties in comparing results and deriving information on banks’ sustainability.
Average national correlation between EUT eligibility and alignment rate

Simplified disclosures but at what cost?
This year’s European Taxonomy disclosures were marked by the 2025 sustainability regulation turmoil. Despite all 50 banks in our sample continuing to disclose despite the two-year exemption, the results are not comparable with those of previous years. Indeed, over half of the banks included in our research applied the new Taxonomy methodology introduced through the sustainability Omnibus. Two consequences are derived from this.
Firstly, the average GAR and eligibility ratio significantly increased compared to the last two years. While in both 2023 and 2024 the average GAR (on Turnover KPI) struggled to reach the 4% mark, the 2025 result lies just above 7%. The same conclusion can be reached when looking at the eligibility ratio, which is at 55% on average for our sample, up from the 36% in 2023 and 37% in 2024. While this could appear as an encouraging signal of European banks’ transition towards greener activities, it reflects purely mathematical changes in the calculations, pushing results upwards.
Secondly, the methodology change prevents comparisons between banks as well as results with previous disclosures. As the results obtained with the Omnibus-updated calculation exclude a significant amount of assets and tweak the results upwards, it is now impossible to compare banks’ 2025 GAR to the ones derived under the ‘old method’.
Beyond the lack of comparability of this year’s Taxonomy reporting, the sustainability Omnibus brought a deeper change in the disclosures, reshaping the GAR into an indicator focused on banks’ mortgage portfolios by excluding most corporates from the calculation.
Despite the two-year reporting pause, most banks continued to disclose their Taxonomy template to align with other regulatory requirements, leaving them to navigate ongoing legislative uncertainty. At the same time, the reduced scope of ESG disclosures will continue to create data availability and quality challenges, as fewer corporates are required to report while banking requirements are not yet fully aligned with the Omnibus changes.
The main goal of the sustainability Omnibus was to simplify and lighten entities’ reporting burden. One might question whether such an ambition was achieved.
Content Disclaimer
This publication has been prepared by ING solely for information purposes irrespective of a particular user's means, financial situation or investment objectives. The information does not constitute investment recommendation, and nor is it investment, legal or tax advice or an offer or solicitation to purchase or sell any financial instrument.Read more