EM Sovereigns: Debt sustainability remains a concern but will only become acute for some
- 7 January 2021
- FX Credit Bulgaria Croatia
With fiscal deficits set to remain high, the aggregate debt/GDP ratio for emerging markets governments is set to rise further, from around 60% in 2020 towards 70% of GDP in the medium term based on IMF projections. Therein lies the biggest risk for emerging markets, one that will be ever present in the coming decade. We explore further and assess the risks

EM sovereigns not out of the woods, debt sustainability remains a concern but only acute for some
Already in 2020, we have seen a large number of sovereign defaults, notably in Argentina, Belize, Ecuador, Lebanon, Suriname and Zambia. Over the next years, debt sustainability and downgrade fears will remain with us as fiscal deficits in emerging market economies are projected to remain high: The IMF expects a 8.8% of GDP fiscal deficit in 2021 for EMs as a whole (vs a 10.1% deficit in 2020) which will gradually come down to 6.1% of GDP in 2025. Thus, the general government gross debt burden is set to rise from currently around 61% towards 70% of GDP in the medium term.
We, however, believe that default concerns will become only become acute for some, particularly sovereigns that are struggling with stabilising their debt trajectory (due to structurally high deficits and/or low growth), spend a too high portion of their revenues on debt servicing and/or rely on external debt markets for refinancing. With our FX strategists expecting a supportive backdrop for EM currencies, a high FX debt/total debt share should pose less of an imminent threat for now.
Among the larger sovereigns, the concerns are largest in Brazil and South Africa with debt stabilisation hinging on economic and fiscal reforms. In frontier EM, Sri Lanka is the weakest link, with stretched debt/GDP, interest servicing and external refinancing needs (including a US$1bn Eurobond maturity this year) amid low fiscal credibility. Angola, Bahrain, Egypt, Oman and Pakistan have a combination of increasing debt burden or high levels to start with, high interest service and/or elevated financing needs, but benefit from supportive anchors (IMF programmes or other sponsors). Others with fiscal vulnerabilities include Costa Rica (rising debt burden and high interest service), El Salvador (high debt burden and interest service amid 2021 elections), Ghana (high debt burden and interest service) and Kenya (rising debt on large primary deficits and high interest service).
External vulnerabilities should remain in check thanks to the favourable backdrop, but Bahrain, Belarus, Sri Lanka, Tunisia and Turkey, among others, continue to have weak balance sheets (notably low FX reserves and high external financing needs).
Government debt levels: No near-term stabilisation, reforms needed to avoid debt spiral for some
In the chart below, we compare the general government gross debt levels for emerging market economies in 2020 vs their projected level in 2025 by the IMF.
General government gross debt projections for 2020 vs 2025 (% of GDP)
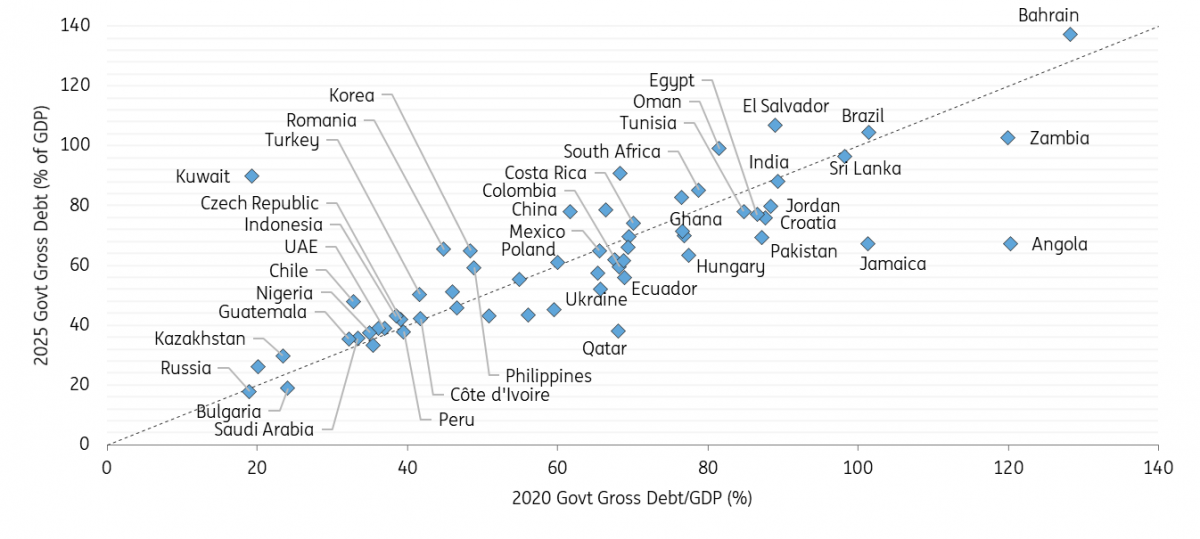
We look out for large increases, or more modest ones in the case of already high debt levels. The IMF expects the highest increase in gross debt/GDP between 2020 and 2025 for Kuwait (+71 percentage points to 90% in 2025), Romania (+21ppt to 65%), Oman (+18ppt to 99%), South Korea (+17ppt to 65%), China (+16ppt to 78%), Chile (+15ppt to 48%) and Kenya (+12ppt to 79%). Meanwhile, Bahrain (+9ppt to 137%), Brazil (+2ppt to 104%) and South Africa (+6ppt to 85%) see more modest increases, but with already high debt levels to begin with.
In contrast, the largest reduction in debt levels is projected for Angola (-53ppt to 67%) Qatar (-30ppt to 38%), Pakistan (-18ppt to 69%), Serbia (-15ppt to 45%), Hungary (-14ppt to 63%), Ukraine (-14ppt to 52%), Ecuador (-13ppt to 56%), Ethiopia (-13ppt to 56%), Croatia (-12ppt to 76%) and Egypt (-10ppt to 77%) over the same time horizon.
It is important to highlight that this is not set in stone and we believe the IMF forecasts tend to be too optimistic for EM sovereigns that had increased their debt/GDP ratios in previous years but are projected to reduce or stabilise their indebtedness in the coming years.
Among the larger economies, Brazil and South Africa have seen their debt/GDP ratios rising to high levels (>80%) amid subdued growth even before the pandemic (respective average growth of 1.5% and 0.8% between 2017 and 2019), thus stabilisation hinges on reform implementation. This is also the case for the GCC oil exporters, with an additional sensitivity coming from the oil price outlook. Most have started fiscal consolidation following the oil price collapse in 2014/15 but debt/GDP has nonetheless risen substantially over the past five years, with Bahrain and Oman seen as more vulnerable given higher debt ratios and limited reserve assets.
Lastly, the IMF’s optimism is evident for sovereigns that are in a lending arrangement with the fund, including Angola (US$3.7bn 3yr Extended Fund Facility or EFF since December 2018), Pakistan (US$6bn 39-month EFF since July 2019) and to a lesser extent Ecuador (US$6.5bn 27-month EFF since September 2020). For those, debt/GDP has risen by 10-30ppt over 2015 to 2019 but is projected to fall substantially over the next five years. However, we acknowledge that IMF programmes with Egypt (since 2016) and Ukraine (on and off since 2015) have led to a 15-30ppt decline in debt/GDP until 2019 while we had seen reform progress in Angola and Pakistan before the pandemic.
Debt service: Risks loom large for frontier EMs while stronger sovereigns benefit from record low yields
When it comes to interest service on government debt, we have seen two key drivers: Principally, increased borrowing will mean that sovereigns have to pay more on the larger nominal amount of debt outstanding and an increased risk premium. However, we have seen evidence for lower borrowing costs in countries that benefited from very accommodative monetary policies, although this has been mostly limited to economies with deep local debt markets (thanks to rate cuts and central bank bond purchases) and stronger fundamentals (with high grade sovereigns having dominated hard-currency debt issuance this year). As an example, interest rates on 10yr Mexican local-currency government bonds (BBB average rating) have fallen by 140bp over 2020 while those of South Africa (BB-) have fallen only by around 30bp over the same time as fiscal concerns have persisted.
In the chart below, we note that interest service weighs notably on frontier markets due to a combination of higher indebtedness, higher coupons and lower revenue capacity (as a % of GDP). Sri Lanka stands out with the highest interest payment/revenue ratio by a wide margin (62% in 2021), followed by Zambia (44%), Ghana (44%), Egypt (42%), Costa Rica (40%), Pakistan (39%), India (32%) and Angola (31%). In order to reduce debt, some of these countries have been required to run primary fiscal surpluses to reduce or stabilise their debt burden (as seen in Angola, Egypt and Jamaica).
Interest payment (% of revenues) vs primary fiscal balance (% of GDP) in 2021

External vulnerabilities: Window of opportunity to improve external resilience but some remain vulnerable
Going into 2021, we are generally less concerned about external vulnerabilities as they have decreased for many and are contained by a favourable external backdrop driven by a weak dollar and continued inflows.
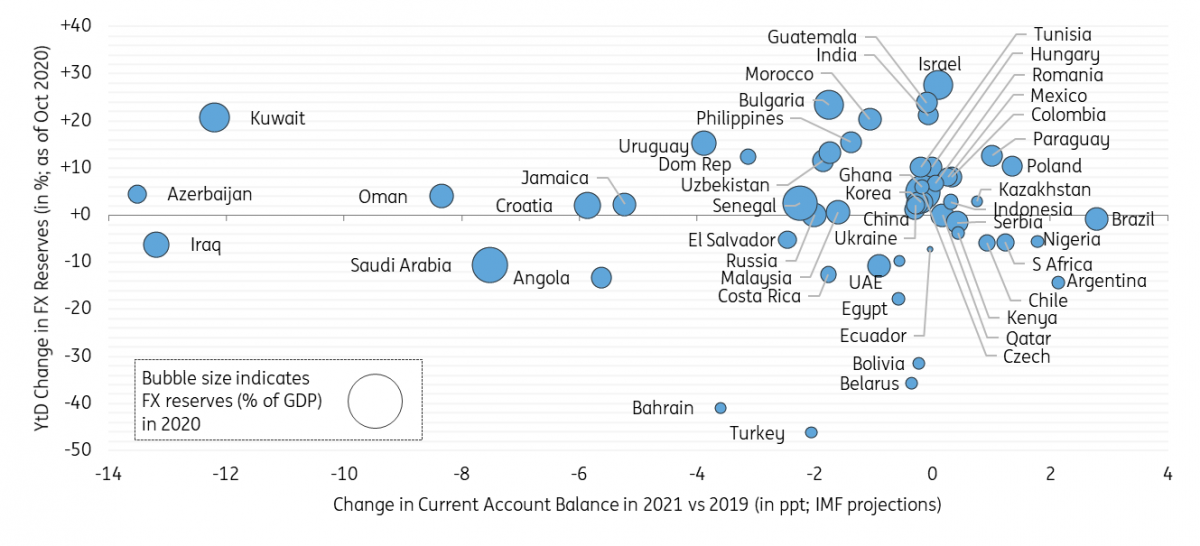
Particularly for large commodity importers which tend to run current account deficits, the latter have narrowed (eg, for Brazil, Indonesia and South Africa) or become surpluses (India, Mexico, Philippines and Ukraine) in 2020 due to pandemic-driven import compressions. Many of those will continue to run lower deficits in 2021 when compared to levels in 2019 (x-axis in the chart below; based on IMF forecasts). In contrast, sovereigns that are reliant on commodity exports (Angola, Azerbaijan and Bahrain, Iraq, Oman and Saudi Arabia) and tourism (Croatia and Jamaica) see a deterioration.
Moreover, we believe that prudent FX reserve management has resulted in higher FX reserves (y-axis), a trend that should continue next year based on our view of a weak US dollar. However, Turkey (-46% YtD as of October 2020), Bahrain (-41%), Belarus (-34%) and Bolivia (-32%) have depleted their FX reserves, which have come down to a very low 6-7% of GDP as of October 2020 (see bubble size).
C/A balance differential between 2019 and 2021 (ppt) vs FX reserve YtD change (%; as of October 2020)
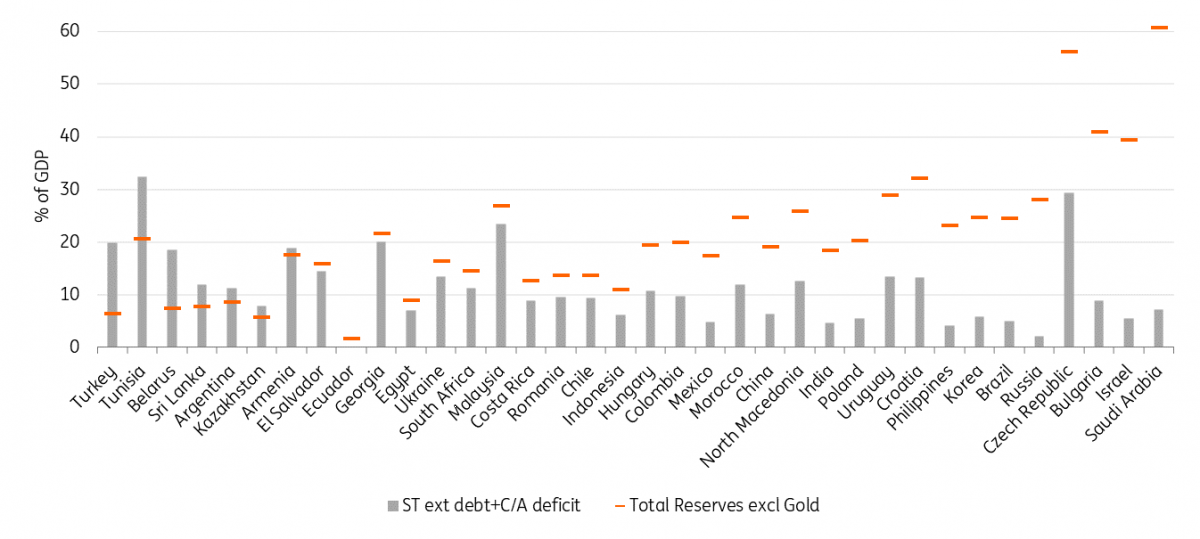
We also compare short-term external financing needs (as a proxy, we use the IMF current account balance projections for 2021 and the World Bank’s external debt statistics) vs FX reserves. External vulnerabilities are high for those economies where FX reserves don’t cover financing needs over the next year. This is the case for Turkey, Tunisia, Belarus, Sri Lanka, Argentina, Kazakhstan (when excluding sovereign wealth assets) and Armenia, although we note that there is a lack of external debt statistics for smaller economies (eg, missing for Bahrain which also screens as vulnerable). We will continue to monitor FX reserves and refinancing needs but believe that the favourable backdrop should facilitate access to external funding sources for most sovereigns in 2021.
Short-term external refinancing needs vs FX reserves (% of GDP; sorted by lowest differential)
Eurobond maturities: Limited risks from external sovereign debt redemptions in 2021 but Sri Lanka under intense scrutiny
Similarly, the favourable external backdrop should allow lower rated sovereigns to approach the primary market in 2021 in order to plug fiscal deficits or refinance debt. When it comes to the latter, sovereigns that are rated single B or lower will face a modest US$12.6bn of Eurobond debt redemptions in 2021, slightly down from US$13.4bn in 2020 (we exclude debt in default). Moreover, almost half of that amount can be attributed to Turkey (US$6.4bn across three bonds and one sukuk) which has been able to return to debt markets in end-2020 (and should be able to do so again in 2021). The remainder is split across Oman (US$1.5bn in June 2021), Bahrain (US$1.0bn in January) Pakistan (US$1bn in October), Sri Lanka (US$1bn in July), Ukraine (US$1bn in September), Nigeria (US$0.5bn in January) and Senegal (US$0.3bn in May). Among them, Sri Lanka screens as the most vulnerable based on our previous analysis with high debt/GDP, an unsustainable interest payment/revenue ratio, low FX reserves (vs external financing needs) and annual Eurobond redemptions of US$1.0-2.2bn annually until 2030.
The amount of annual debt redemptions for B and lower rated sovereigns will gradually rise from a still low US$16bn in 2022 to US$29bn in 2025. However, as many sovereigns tend to actively manage their debt profile (and tender bonds early), this should see a smoothening of the debt maturity profile (in 2020, we have seen buybacks by Ivory Coast, Mongolia and Ukraine, among others). The amount, however, would rise if we were to see more sovereign downgrades, which appears likely as we counted eight sovereign that have at least one BB- rating with a negative outlook.
Content Disclaimer
This publication has been prepared by ING solely for information purposes irrespective of a particular user's means, financial situation or investment objectives. The information does not constitute investment recommendation, and nor is it investment, legal or tax advice or an offer or solicitation to purchase or sell any financial instrument.Read more