IMF World Economic Outlook: Looking beyond the pandemic for emerging markets
- 15 October 2020
- Credit Bulgaria Croatia
The IMF’s latest flagship report provides insightful analysis as the global economy climbs out of a deep recession. Relative to their June forecast, the fund expects a somewhat less severe recession but says the recovery is likely to be long, uneven and highly uncertain
In its latest World Economic Outlook, the IMF predicts the global economy to experience a 4.4% contraction in 2020 (+0.8ppt vs its June estimates) and a partial rebound to 5.2% growth in 2021 (-0.2ppt).
The improved outlook for 2020 stems from better-than-expected growth in advanced economies (2020 growth forecast of -5.8% vs -8.1% in June) and China (+1.9% vs +1.0%) as well as signs of a more rapid recovery in 3Q20 as lockdowns were relaxed. In contrast, the outlook for emerging market and developing economies (ex-China) has deteriorated (-5.7% vs -5.0%). Notwithstanding, we find a large divergence with some pockets of resilience while others have seen substantially worsening prospects.
We take a look at near-term growth outlook for emerging markets and hone in on the IMF’s medium-term projections on growth, inflation, the balance of payments and government finances
Overwhelmed health care systems, greater dependence on external finance, including remittances and lack of tourism in certain key hotspots are just some of the reasons behind this precarious situation. Higher population growth and low starting levels of income mean even modest contractions will take a very heavy toll on living standards, especially for the poor, increasing regional divergences and income differences between advanced and emerging and developing economies (excluding China).
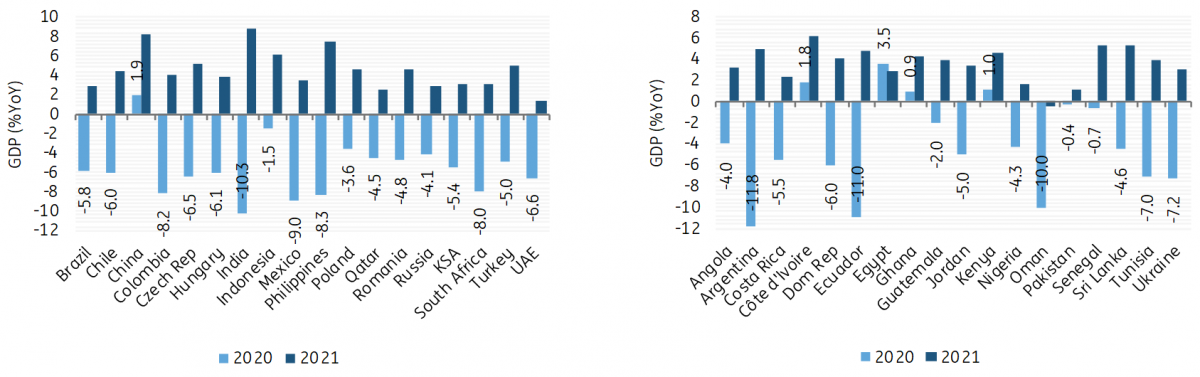
- Asia (-1.7% in 2020; +8.0% in 2021) faces a more modest recession and is best positioned for the recovery, with China projected to grow by about 10% over 2020–21 (+1.9% in 2020; +8.2% in 2021). However, India’s growth forecast has been cut again (-10.3%; -5.8ppt vs June) followed by an 8.8% rebound in 2020.
- Latin America (-8.1%; +3.6%) faces the deepest recession this year (despite an 1.3ppt upward revision vs June), dragged down by Peru (-13.9%), Argentina (-11.8%), Ecuador (-11.0%) and Mexico (-9.0%) although fiscal stimulus will contain Brazil’s contraction (-5.8%). In 2021, the region is set for a modest recovery.
- In between those two extremes are Emerging Europe (-4.6%; +3.9%), Middle East & Central Asia (-4.1%; +3.0%) and Sub-Saharan Africa (-3.0%; +3.1%). Notably in the latter two, we find some pockets of growth in 2020 (Egypt, Ivory Coast, Kenya and Ghana). In contrast, South Africa’s is set to face the steepest decline (-8.0%; +3.0%).
Downside risks continue to come from the pandemic, trade policy and geopolitical uncertainty, among others. The fund also urged governments not to prematurely withdraw support. In contrast, faster and more widespread Covid-19 testing, treatments, vaccines, and additional policy stimulus pose upside risks.
Here, we take a look at near-term growth outlook for emerging markets and hone in on the IMF’s medium-term projections on growth, inflation, the balance of payments and government finances.
IMF WEO 2020-21 GDP growth projections across country groups and regions (% YoY)

Growth: An uneven recovery
All together (including China), output in emerging market and developing economies is set to decline by 3.3% this year (-0.2ppt vs June WEO update), followed by a 6.0% recovery in 2021 (+0.2ppt).
Looking beyond, growth is forecasted to decline from a 5.6% average in 2000-19 to 4.7% by 2025 as the structural slowdown in China seen before the pandemic is expected to continue, commodity prices remain subdued (Brent projected to average US$51/bbl in 2021-25) and external demand prospects remain weak.
GDP growth in 2020-21 (% YoY) for major and frontier EM
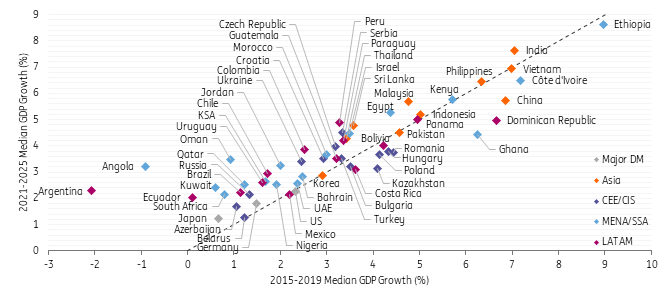
However, compared to median growth in the five years before the pandemic (2015-19), the IMF’s projection for the five years ahead (2021-25) reflects some optimism with most economies set to embark on a higher growth path (see chart below). Asia stands out as the growth engine which is unlikely to change despite China’s structural slowdown (median growth is set to fall from 6.8% to 5.7%). Meanwhile, growth in most CEE economies is likely to be slower than pre-pandemic (except for Croatia, Czech Republic and Serbia).
Argentina and Angola which faced recessions in the years preceding Covid-19 are seeing the largest improvements. Ghana and the Dominican Republic are set to slow most but from high levels. Among the major economies, hopes are that Brazil, Russia and South Africa can unleash themselves from structural impediments, with median growth seen around 2% in 2021-25 (vs c.1% in 2015-19).
Median GDP growth in 2015-2019 vs 2021-2025 (% YoY)
Inflation: Lower for longer with monetary policies remaining supportive
The IMF expects inflation to decline from 5.0% in 2020 to 4.7% next year and moderating to 4% by 2025. With inflation set to remain low, major central banks anticipated to maintain their current policy setting until 2025 and improved monetary policy credibility, this provides a still supportive setting for EM central banks.
Based on Bloomberg consensus, policy rates are expected to remain stable in Asia and declining in Africa while some CEE/CIS and LATAM central banks could turn to modest rate hikes.
CPI in 2020-21 (% YoY) for major and frontier EM
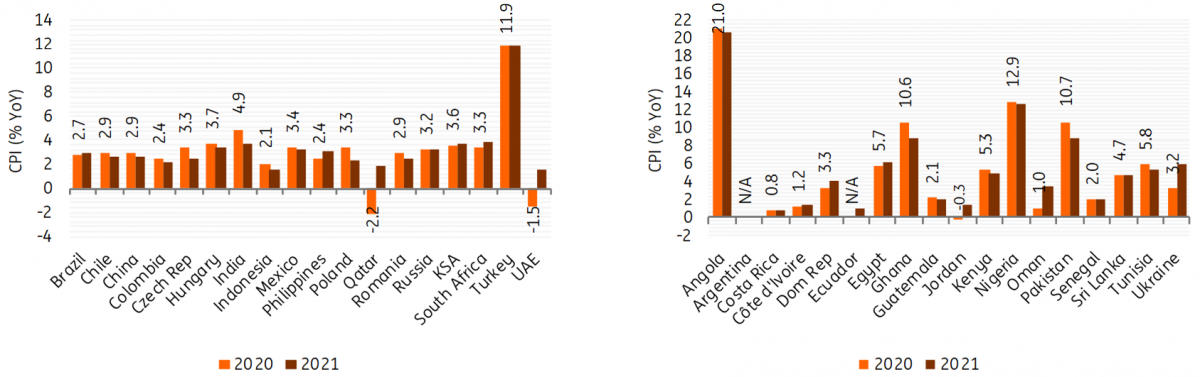
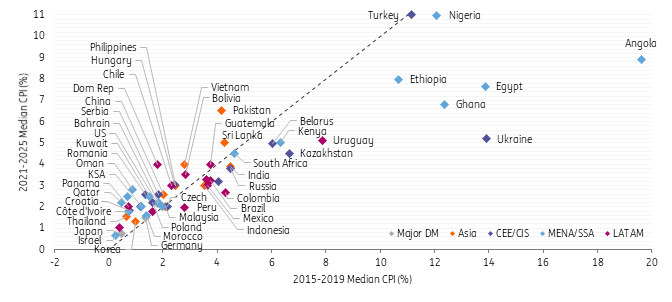
In the chart below, we note that inflation pressure is relatively contained for most EMs, with some upward pressure in CEE (vs pre-pandemic levels) and inflation historically higher in the larger LATAM economies (averaging 3.0-3.5% pre and post-pandemic).
Angola, Ukraine, Egypt and Ghana stand out for a much more benign inflation path going forward, having already been successful in bringing down inflation from excessive levels pre-pandemic
On a country level, Pakistan, the Dominican Republic and Oman see some uptick in projected median inflation in 2021-25 compared to 2015-19 (by around 2.0-2.5ppt). However, double-digit inflation remains a policy constraint for Nigeria and Turkey. Meanwhile, Angola, Ukraine, Egypt and Ghana stand out for a much more benign inflation path going forward, having already been successful in bringing down inflation from excessive levels pre-pandemic.
Inflation is lowest in more developed economies with strong fundamentals (e.g. Israel and Korea) or in those with pegs to the euro or dollar (e.g. Croatia, Ivory Coast, Morocco, Panama and some MENA countries).
Median CPI in 2015-2019 vs 2021-2025 (% YoY)
Current account balance: Structural deterioration in commodity exporters
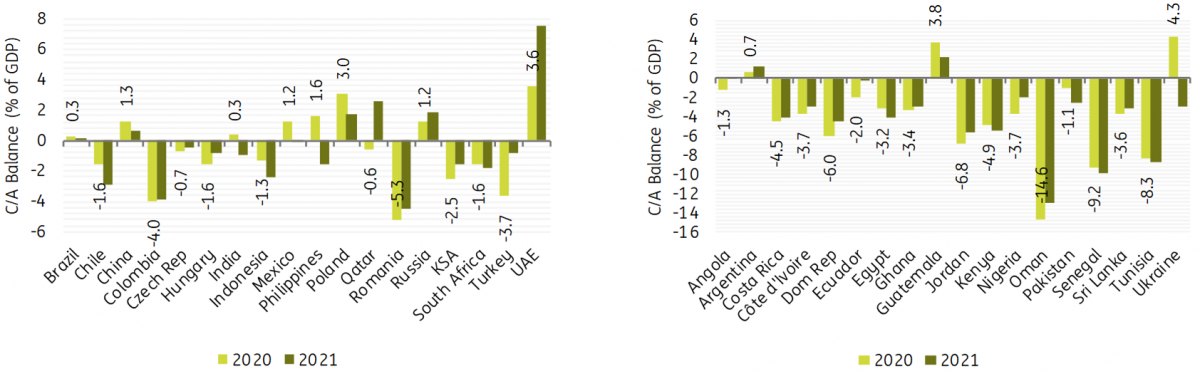
The impact on current account balances from the crisis has been more ambiguous as countries faced a collapse in exports and imports at the same time. Current account balances have deteriorated notably for countries dependent commodity exports (e.g. Russia and GCC) and tourism (e.g. Croatia and Jamaica) but improved for many others (e.g. Brazil, Indonesia, Poland, South Africa and Ukraine).
Current account balance in 2020-21 (% of GDP) for major and frontier EM
The global recovery and notably China’s strong growth levels should see much of an improvement in 2021 but the impact is likely to fade in subsequent years. Notably, the IMF expects trade volume of goods and services to rise by 8.3% next year (vs- 10.4% in 2020) but return to average levels of 4.3% between 2022-25. Meanwhile, China’s volume of goods and services imports could rise by 10% next year (vs -2.7% in 2020) but plateau around 4.4% subsequently.
The global recovery and notably China’s strong growth levels should see much of an improvement in 2021 but the impact is likely to fade in subsequent years
Lastly, the outlook for commodity exporters remains depressed, with the IMF seeing Brent crude averaging US$51/bbl in 2021-25, which should also go along with a deterioration of their current account balances on average (with Oman as a big outlier improving from unsustainable levels).
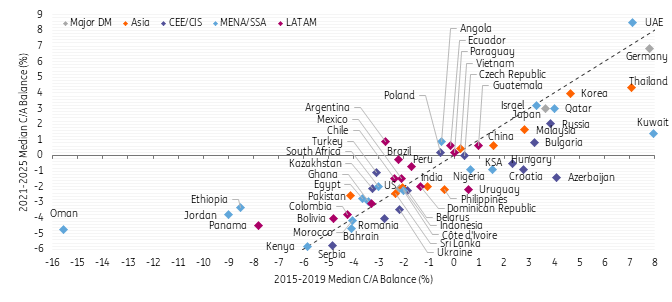
Interestingly, the largest surplus and deficit are both found in the MENA region (UAE and Oman, respectively). Across regions, we note that Asia and CEE/CIS are more or less evenly balanced but in LATAM and MENA/SSA, deficit countries outweigh.
Median C/A balance in 2015-2019 vs 2021-2025 (% of GDP)
Fiscal balance and government debt: Debt sustainability concerns persist
The pandemic has wrecked fiscal accounts globally, driven by weaker growth and large deficits (lower tax and commodity revenues and higher spending to support the economy) which will lead to a substantial jump in debt burden this year.
Advanced economies on balance are forecasted to run a 14.2% of GDP fiscal deficit this year, with general government gross debt rising by 20ppt to 124% of GDP. Thereafter, deficits will come down to 3.3% of GDP by 2025 with the debt/GDP remaining stable.
The pandemic has wrecked fiscal accounts globally, driven by weaker growth and large deficits (lower tax and commodity revenues and higher spending to support the economy) which will lead to a substantial jump in debt burden this year
EM economies will run a fiscal deficit of 10.4% of GDP in 2020 with debt/GDP rising by 9ppt to 61%. While deficits remain high in 2021 (8.8% of GDP), the growth rebound will limit the rise in debt/GDP next year (to 64.0%) while low-interest rates and a likely extension of the G20’s debt service suspension initiative are supportive tailwinds for now.
However, with deficits only coming down to a still-high 6.1% of GDP in 2025, the aggregated EM debt burden will continue to rise towards 70% in the medium-term. By that time, we also note that the amount of Eurobond debt redemptions of sovereigns rated single B or lower is set to peak at around US$30bn, a steep increase from the US$11bn net year. Thus, renewed calls for private creditors to participate in providing relief and the IMF’s message to governments to restructure earlier rather than later where debt is unsustainable are not surprising. In the coming years, we, therefore, believe that debt sustainability concerns and downgrade fears will remain with us.
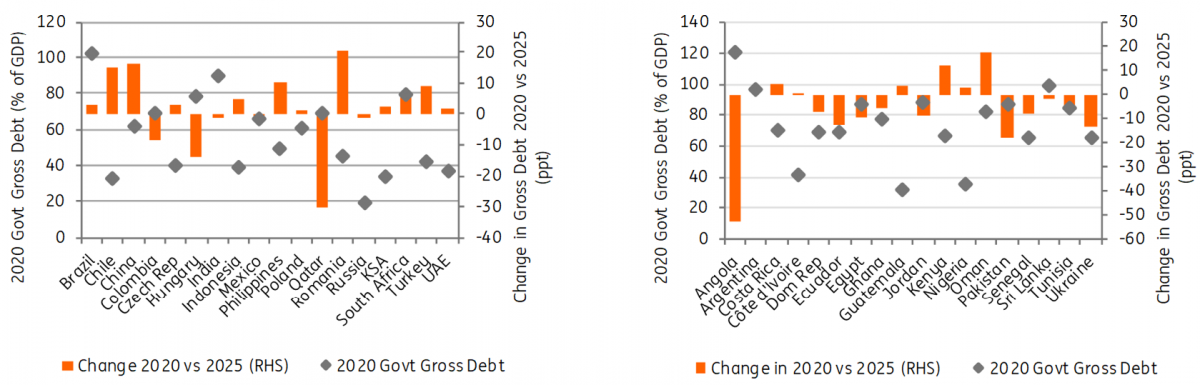
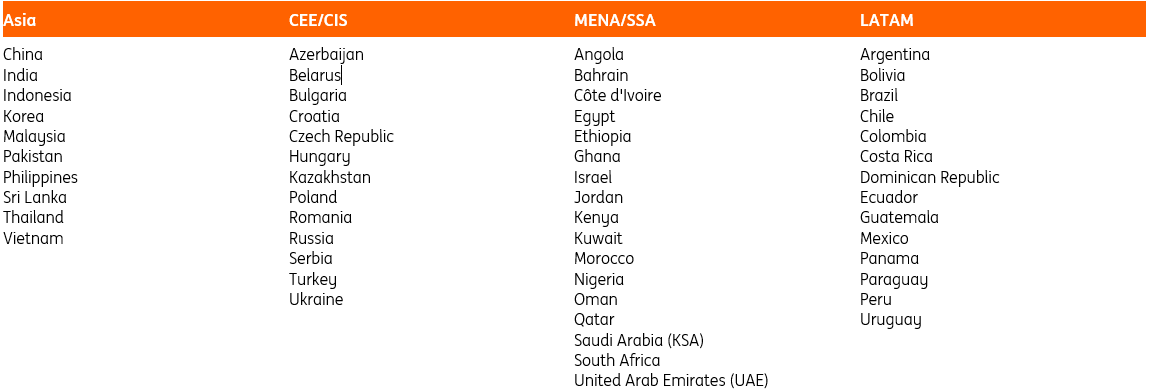
Fiscal balance in 2020-21 and government gross debt in 2020 (% of GDP) for major and frontier EM
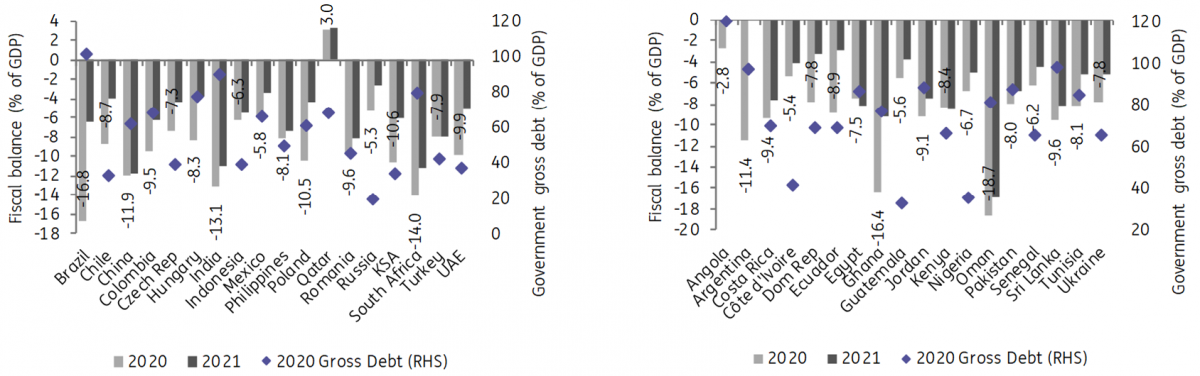
The charts below reveal a large divergence in the medium-term debt outlook for EM sovereigns, with extremes found in the MENA region. Most GCC economies are likely to see an improvement to their fiscal balances vs the five years before the pandemic, but the deficits remain very wide for Bahrain and Oman which already have high gross debt levels (128% and 82% of GDP, respectively, in 2020). In contrast, Kuwait’s deterioration is staggering, but the starting point has been strong (19.3%).
- Among larger sovereigns, the IMF expects the highest increase in general government gross debt/GDP between 2020-25 in Romania (+21ppt to 65% in 2025), South Korea (+17ppt to 65%), China (+16ppt to 78%), Chile (+15ppt to 48%), the Philippines (+10ppt to 59%), Turkey (+9ppt to 50%) and South Africa (+6ppt to 85%).
- In frontier and other EM, we see the biggest jump in Kuwait (+71ppt to 90% of GDP in 2025), Oman (+18ppt to 99%), Kenya (+12ppt to 79%) and Bahrain (+9ppt to 137%).
- In contrast, Angola (-53ppt to 67%), Qatar (-30ppt to 38%), Pakistan (-18ppt to 69%), Serbia (-15ppt to 45%), Hungary (-14ppt to 63%), Ukraine (-14ppt to 52%), Ecuador (-13ppt to 56%), Ethiopia (-13ppt to 56%), Croatia (-12ppt to 76%) and Egypt (-10ppt to 77%) will see the strongest improvements over the same time horizon.
Median fiscal balance in 2015-2019 vs 2021-2025 (% of GDP)

CAGR of government gross debt/GDP in 2015-2019 vs 2021-2025 (% YoY)

Government gross debt in 2020 (% of GDP) and change in gross debt through 2020-25 (ppt) for major and frontier EM
Appendix: List of selected countries included in assessment and charts
Content Disclaimer
This publication has been prepared by ING solely for information purposes irrespective of a particular user's means, financial situation or investment objectives. The information does not constitute investment recommendation, and nor is it investment, legal or tax advice or an offer or solicitation to purchase or sell any financial instrument.Read more
Included in the following bundle
US hero, rates moving to zero
- This bundle contains 6 Articles