US: Blowing the budget
The combination of plunging tax revenues and massive government stimulus spending in response to the Covid-19 crisis means government borrowing came in more three times higher than any previous month in history. The US is on course to hit a fiscal deficit of 20% of GDP in 2020, double the Global Financial Crisis peak of 10% ten years ago
| $737.9 |
The April monthly government deficitbillion |
Tax revenues crushed, spending surges
The US monthly budget statement shows a deficit of $737.85 billion, which means fiscal year to date (Oct-Apr) we are already up at a deficit of $1.48 trillion versus $531bn for the same period last year. Tax receipts are down 9.7% Fiscal YTD and for April alone are less than half of what they were in April 2019 as lower employment and corporate profits weaken the tax base. Meanwhile spending is up 29.3% fiscal year to date while April 2020 alone is 261% higher than April 2019 as the government support packages really start to kick in.
Today’s numbers highlight the economic damage from the crisis, but also show how swiftly government has been able to step in to try and mitigate some of the effects that Covid-19 containment measures are having. Nonetheless, with unemployment continuing to climb and the corporate earning outlook highly uncertain, we expect to see even bigger borrowing figures in the months ahead.
Social distancing will limit the scope for businesses to re-open while consumer angst about the virus will be with us until there is a vaccine. Travel restrictions and the ongoing negative effects of 35 million plus Americans out of work will further constrain the recovery and the ability of tax revenues to bounce back. We also wouldn’t rule out an additional round of fiscal stimulus which means there is upside risk to our forecast of the US fiscal deficit to to rise to nearly 20% of GDP this year with government debt to break above 100% of GDP.
ING forecasts for government deficit and debt as % of GDP

The US position was already weak
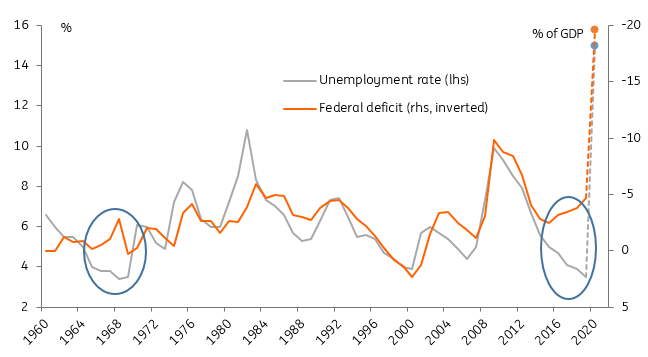
It must be said that the US fiscal position was in a pretty poor state even before we entered the current crisis. As the chart below shows, when unemployment is falling, the deficit typically falls as there are more people in work paying taxes and there are higher corporate profits and less social security spending. Conversely when unemployment is rising, the deficit rises for the opposite reasons. However, since 2016 we see that the relationship has broken down with ever rising fiscal deficits despite unemployment hitting new lows.
We have seen this situation before, in the late 1960s, but this was tied to the Vietnam War. Sending millions of young men off to battle obviously drives down unemployment while spending hundreds of millions on military equipment and ammunition drives up the deficit. However, the 2016-2019 period wasn’t associated with a major conflict, therefore highlighting a more structural issue caused by aggressive tax cuts.
We have included our forecasts for the average annual unemployment rate for 2020 and where we think the fiscal deficit is heading. It suggests the series are converging once again, but how we return to more sustainable government finances in the medium term will be a major issue during the next Presidential term, although we have our doubts it will appear high up on the lists of priorities as Presidential debates get underway. With a rapidly ageing population, there will be significant challenges to achieving it.
US government deficit and unemployment with ING forecasts for 2020
The circles highlight the divergence in the relationship between unemployment and the deficit. The first (1960s) was caused by the Vietnam War. The second is largely a tax cut-related phenomenon.

This publication has been prepared by ING solely for information purposes irrespective of a particular user's means, financial situation or investment objectives. The information does not constitute investment recommendation, and nor is it investment, legal or tax advice or an offer or solicitation to purchase or sell any financial instrument. Read more
Download
Download snap