- Opinion by James Knightley
How much is AI contributing to US economic growth?
- Published 11:44
- TMT United States
Multibillion-dollar investments in AI technology and data centres have boosted US economic activity, but in calculating the contribution we need to acknowledge global supply chains. Direct consumer spending on AI subscriptions is limited right now with wealth effects being more impactful. We believe AI accounts for a third of economic growth in 2026

The arrival of ChatGPT and subsequent release of other generative artificial intelligence tools has prompted a technology investment boom. US technology firms are vying for the lead, battling foreign competitors, primarily from China. Meanwhile, the US government sees this as a critical economic and national security issue for coming decades and has been willing to incentivise and support initiatives.
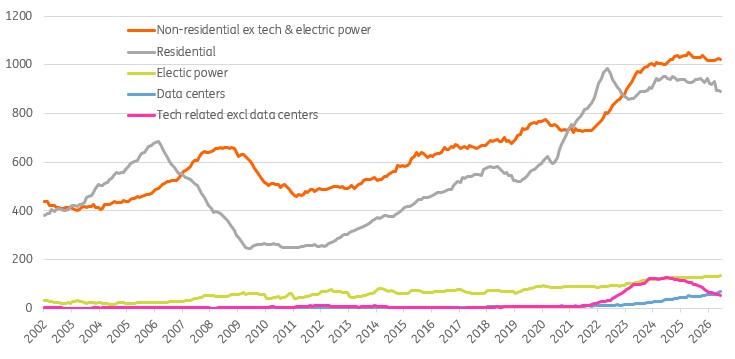
The result has been a substantial increase in spending on construction of data centres and electric power generation. In fact, these are the only sectors where we are currently seeing construction spending growth. Residential construction is being hampered by elevated mortgage rates and a general lack of affordability following the post-pandemic surge in residential property prices. Technology, excluding data centres, has fallen back following the conclusion of President Biden’s 2022 CHIPS and Science Act that provided $52.7bn to boost domestic semiconductor manufacturing and research. Meanwhile, all other non-residential construction is flat lining.
Construction spending ($bn annualised)
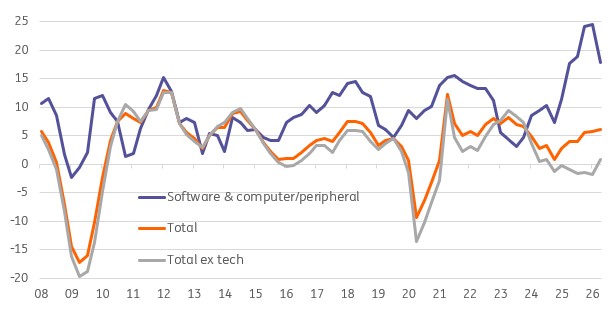
The surge in activity is even more apparent when we look at the GDP measure of non-residential business capital expenditure. If we group computing and peripheral, together with software investment, we see a cumulative 62% increase in real spending since the first quarter of 2022. The frenzied spending on tech appears to have effectively cannibalised other non-residential business investment, which fell in year-on-year terms for six consecutive quarters between 4Q 2024 and 1Q 2026.
Non residential private fixed investment (YoY%)
What should be included in tech investment?
This has led to plenty of debate over calculations of how much tech investment tied to AI is contributing to US growth rates. Jason Furman at Harvard University suggested that investment in technology and software contributed 92% of US GDP growth in the first half of 2025, at a time when the non-tech sector was struggling. Yet others have suggested it is far less, pointing to the scale of imported technology that needs to be subtracted from the total.
The starting point is looking at investment and its composition. Some analysts have used what we feel is too broad a characterisation of 'technology' investment spending. Information Processing is the headline category that is sometimes cited since it includes computers & peripheral equipment, but it also includes lots of other categories that are not tied to specifically AI-related areas, such as medical instruments and photocopiers and printers. We favour using purely the computer and peripheral equipment components while also including software investment.
Technology investment components (Billions of chained 2017 dollars)
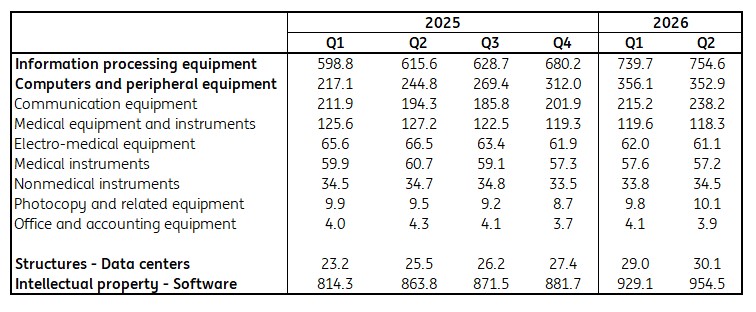
However, even computer & peripheral equipment is too broad a category. While it does include the servers and computer equipment that are used in data centres, it also includes regular computer equipment used in offices. Unfortunately, we cannot break this down, but rationalise that the overwhelming proportion of higher spending in recent quarters is tied to AI. Similarly, we are cognisant that not all software spend is AI related, yet assume that the bulk of the increases in spending are the result of it.
We are on more solid ground with data centre construction spending. However, given it is the computer equipment inside that is the major cost, rather than the physical structure, the contribution from this component will be relatively small.
Remember to subtract the imports…
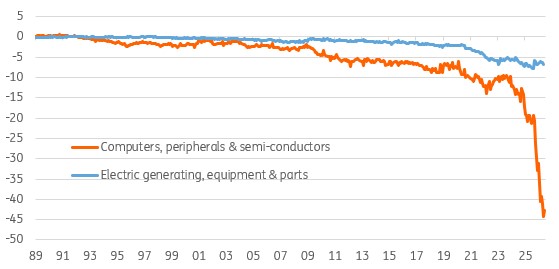
Not all tech investment spending is on items that are made in the United States. Imports subtract from GDP, and we should take account of that when calculating the 'true' contribution of tech/AI investments. Imports of technology-related items have tripled in value over the past two years to $60bn per month. US exports have also increased, but on a far more modest scale, from $9bn per month to $17bn per month. The result is that the trade deficit in computers, peripherals and semiconductors has risen from $20bn per month to more than $40bn per month.
One mitigation is that prices of chips and semiconductors have surged in recent quarters due to strong demand and limited supply, so we need to deflate the nominal dollar values in order to calculate the 'real' growth in imports. We chose to use the PPI measure of 'electronic components and accessories'.
Net trade $bn – US exports of technology products less imports
Regarding international trade in services tied to AI and technology, the applicable category is 'computer services', which captures foreign AI subscriptions and token purchases, but it will also include the likes of computer system design and other priced digital data services. In nominal dollar terms, exports are around $22bn annualised with imports at $19bn with volume growth up 15% YoY for exports and 7.5% YoY for imports in second quarter 2026. For this inclusion, we are again taking probably too aggressive a view that AI-related activity is responsible for all the growth. That said, it is only a tiny proportion of overall economic activity.
Tech investment choices and the results
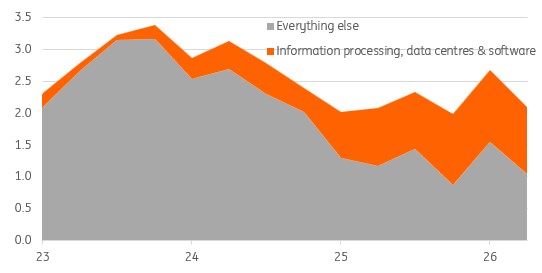
We’ve put together a series of charts showing different ways of calculating the contribution to YoY% real GDP growth. The first shows the broadest measure of 'tech' investment – total information processing, data centre and software investment – without subtracting imports. This categorisation has headline investment accounting for 50.2% of YoY GDP growth in second quarter 2026, with 46.6% being the average contribution to YoY GDP growth over the past four quarters.
If we were to take a stricter definition and include only computing, peripheral and software investment, then it follows a very similar trend to the chart below, but the result is a 44% of GDP growth contribution for second quarter 2026 with a 43.3% average over the past four quarters.
Broadest measure: Tech GDP contribution – All information processing, software & data centre construction (YoY% growth)
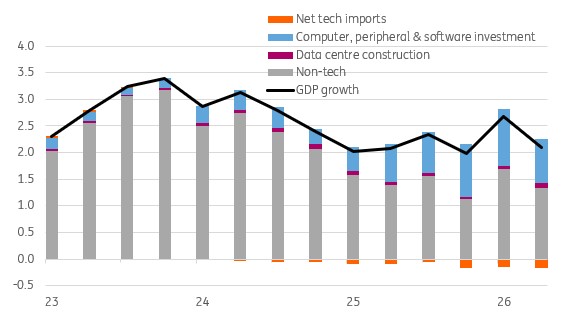
Then if we take that 'core' measure and subtract net imports of computers, peripherals and semiconductors, deflated by 'PPI electronic components & accessories', then we get a more modest 36%, which is actually slightly lower than the 37% average contribution over the past four quarters. We view this as the fairest measure of tech investment we can currently calculate.
Given the issue surrounding uncertainty over what is truly AI/data centre investment and what is, what we might term, legacy tech investment, we suspect there is some over-estimation in these results. However, given the acceleration in tech capex growth since the release of ChatGPT we would only revise down the contribution marginally. As such, we believe that the overall tech investment rollout accounts for around a third of the current YoY rate of US GDP growth.
Narrowest measure: Tech contribution to GDP - computer, peripheral & software investment, data centers less net imports (YoY% growth)
AI’s impact on the jobs market
While AI’s impact on the economy is significant, the impact on the jobs market looks modest currently. The Federal Reserve’s Beige Book, an anecdotal survey on the state of the US economy, suggested in April that “while most Districts indicated that AI had not yet significantly impacted overall staffing levels, some noted that AI-driven productivity improvements had enabled many firms to delay or reduce hiring”. LinkedIn data suggests entry level hiring for graduates has fallen 17% since 2019, while the Bureau for Labor Statistics reported that the unemployment rate for recent graduates (aged 20-24) was 9.7% in July, versus the unemployment rate for all graduates, which is only 2.7%.
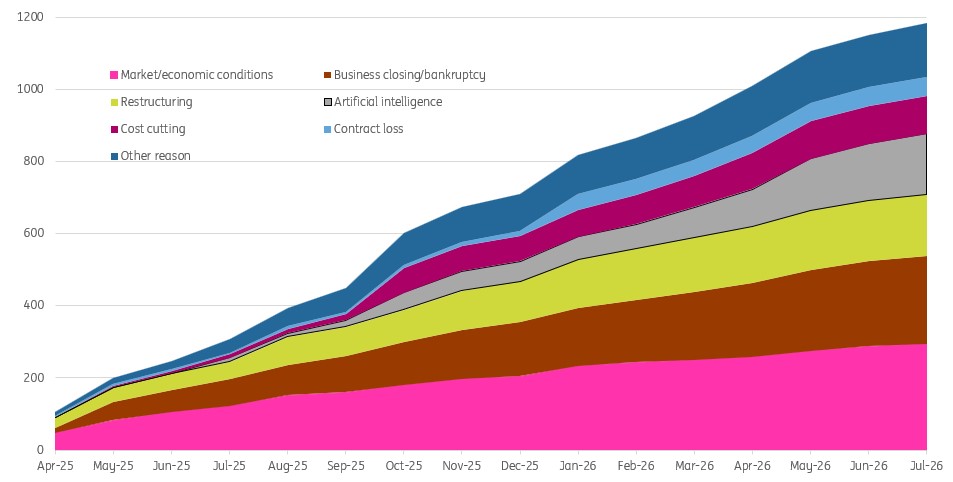
The Challenger, Gray and Christmas report on hiring and layoffs suggests that Artificial Intelligence has been the leading reason for US job lay-offs for the past five consecutive months, cited in 112,713 job cut announcements, or 24% of the total. They suggested that tracking the impact of AI on the jobs market is likely to become increasingly opaque since 'naming AI in a layoff announcement can win over investors while pushing current and prospective employees away'. They argue that regulatory changes may also make companies more careful in how they frame announcements.
Challenger Report: Cumulative job cuts since April 2025 by reason (000s)
AI has intensified the K-shaped consumer narrative
AI enthusiasm is also contributing to GDP growth via consumer spending. Directly through AI token purchases and subscriptions and indirectly via positive wealth effects thanks to the surge in technology company stock prices.
Right now, AI subscriptions account for a tiny proportion of overall consumer spending. Proprietary client spending data from Bank of America and PNC Bank suggest only around 2-3% of American households are spending money on these tools, with a typical monthly spend of $20-30. That is dwarfed by internet, TV and cell phone subscriptions right now, but over coming years that is likely to change, and it will start to make a meaningful contribution.
Instead, it is the wealth effect that is having the largest impact on consumer spending today. Chat GPT was released on 30 November 2022 and, since then, the NASDAQ stock index has risen 130% while the S&P 500 is up 90%. This has contributed to household holdings of financial assets rising from $109tn to $142tn over that three-and-a-half-year time frame. Ownership is heavily skewed towards the top 20% of households by income, who, according to Federal Reserve data, hold 72% of the wealth of America. The bottom 60% of households by income hold merely 15% of its wealth. In an environment of weak consumer confidence and flat-lining real household disposable incomes, this AI-driven wealth surge is likely to be a key factor maintaining the K-shaped consumer narrative whereby high-income households are the driving force behind consumer spending today.
Calculating a number for what extra consumer spending is due to AI wealth gains is difficult. A 2025 Federal Reserve paper suggested that because of the increased concentration of wealth towards higher income groups, the propensity to consume out of wealth has dropped markedly. For the top 20% of households by income, they estimate 0.8 cents of every dollar increase in wealth is spent. For the other 80% of households, who have seen far more modest increases in wealth, that number is closer to 7.5 cents per dollar increase in wealth. That paper estimates a weighted average of 2.6 cents in the dollar until 2020 versus 3.5% in 1990-2005. But with further concentration of wealth in the top 20% of households by income over the subsequent six years, we strongly suspect the number is below 2 cents today and assume 1.5 cents based on that shift in wealth dynamics. Therefore, $33tn of extra household equity wealth translates into roughly $500bn of cumulative extra spending since fourth quarter 2022. Simplistically, that is around an extra $36bn of consumer spending per quarter ($144bn annualised), equivalent to around 0.65pp of 2Q 2026 consumer spending and 0.44pp of GDP.
Content Disclaimer
This publication has been prepared by ING solely for information purposes irrespective of a particular user's means, financial situation or investment objectives. The information does not constitute investment recommendation, and nor is it investment, legal or tax advice or an offer or solicitation to purchase or sell any financial instrument.Read more