
Here’s why 5% is again a risk for the US 10yr
We think the Fed peaked in July 2023. Technically, we won’t know for sure until they cut. But, had a Martian alien landed on earth and simply eyeballed the current movement of the 10yr yield they’d likely conclude that the Fed had not peaked at all. Why? It’s not been trading in a manner consistent with prior peaks. Extrapolate that and 5% is a risk for the US 10yr
In previous cycles, the 10yr yield typically managed to fall, appreciably (blue line in graph below). In the current cycle, the 10yr yield has in fact risen post the peak, and hit its cycle high of 5% in October 2023, some three months after the funds rate peak. And it remains elevated.
What is clear is market rates have not fallen by anything near what would have been typically expected from a “Fed peak moment”. Firm labour market data and pops in inflation data have muddied the water. And the latest payrolls report largely contains more of the same.
The US 10yr (%) as the Fed peaks (blue), and then cuts (orange)
The blue line in the graph below shows the movement in the 10yr yield from the moment the Fed peaks. The orange line shows the movement in the 10yr yield from the moment the Fed cuts. It then extends for 18 months of data.
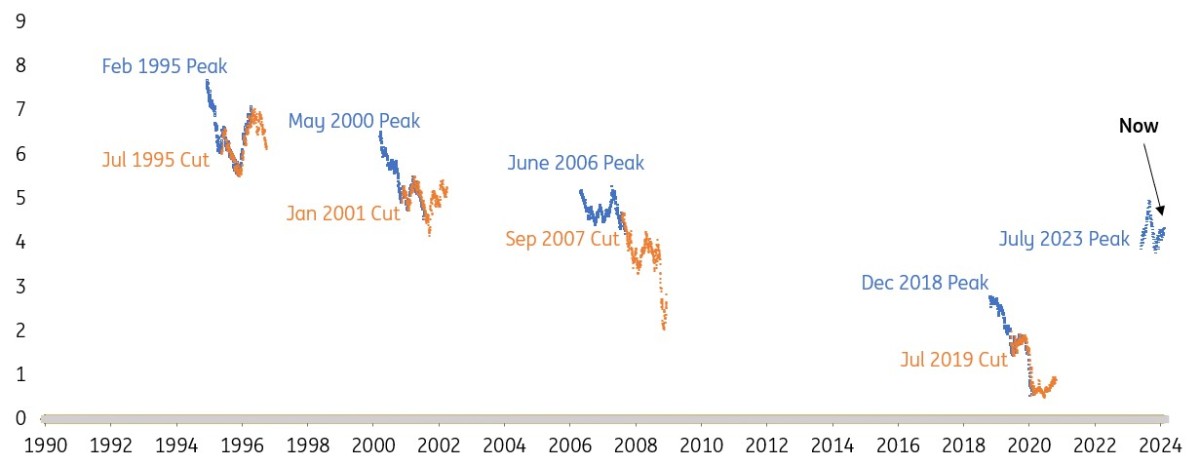
History shows that when the Fed actually cuts for the first time, market rates have tended to pop higher for a bit (chart above). That’s typically a sell on the fact, as the prior rumor had been bought into. But ultimately as the Fed continues to cut, the 10yr yield follows through with further falls, and finds a new bottom.
The magnitude of fall has typically been similar post the peak, and then post the first cut. And the aggregate size of falls are broadly proportional to the size of the rate cuts delivered.
In the current cycle, we’ve not had the first phase fall in the 10yr yield post the peak in rates (hence the confused Martian). In part this reflects a relative shortage of longer-dated Treasuries, a legacy of the pandemic-induced build of Federal Reserve holdings of Treasuries (albeit now falling). This helped manifest in an extremely inverted 2/10yr curve at the moment of the Fed peak. The 10yr yield was still below 4% when the funds rate hit 5.3%.
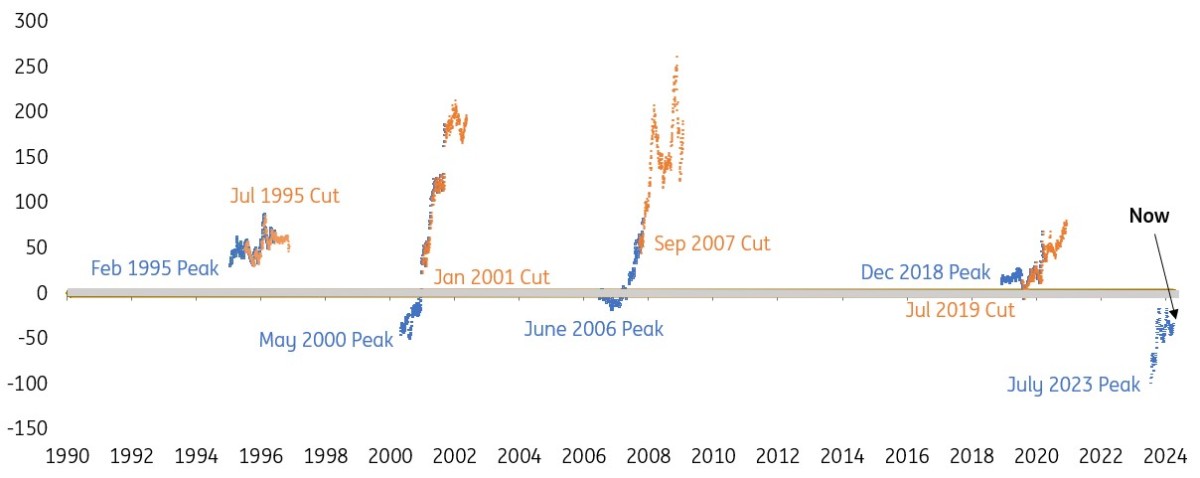
The subsequent move in the 10yr to 5% by October 2023 helped to do some dis-inversion from both ends. And in fact by quite a considerable amount, as the 2/10yr moved from -100bp then to -35bp now (chart below). Previous cycles show that the Fed peak tends to mark the beginning of a dis-inversion (or steepening). But the bulk of the dis-inversion / steepening occurs once the Fed actually starts to cut rates.
US 2/10yr curve (bp) as the Fed peaks (blue) and then cuts (orange)
The blue line in the graph below shows the movement in the 2/10yr curve from the moment the Fed peaks. The orange line shows the movement in the 2/10yr curve from the moment the Fed cuts. It then extends for 18 months of data.
There are a number of implications from this.
First, at the moment the Fed peaked the 10yr yield was arguably too low and the curve too inverted. That has been in part corrected since.
Second, we actually don’t know for sure that the Fed has peaked. It likely has. But until it cuts, by definition it has not peaked.
Third, the data since the Fed has peaked has not been consistent with an excuse to cut, which delays confirmation of July 2023 as the peak.
That in turn exposes an excuse for the 10yr yield to continue to re-test higher, for as long as the economy refuses to lie down. We’re now approaching 4.5%. Hit that, and the next big target is a potential re-visit of 5%. With another run of 0.3% month-on-month readings for March inflation coming in the next few weeks, the pressure builds in that direction.
This publication has been prepared by ING solely for information purposes irrespective of a particular user's means, financial situation or investment objectives. The information does not constitute investment recommendation, and nor is it investment, legal or tax advice or an offer or solicitation to purchase or sell any financial instrument. Read more
Download
Download opinion
Padhraic Garvey, CFA
Padhraic Garvey is the Regional Head of Research, Americas. He's based in New York. His brief spans both developed and emerging markets and he specialises in global rates and macro relative value. He worked for Cambridge Econometrics and ABN Amro before joining ING. He holds a Masters degree in Economics from University College Dublin and is a CFA charterholder.
Padhraic Garvey, CFA