Coronavirus - an update
Markets will open weaker on coronavirus anxiety as China comes back from extended vacations - the PBoC will add liquidity but is unlikely to be able to turn the situation around. Actions are about damage limitation, not reversal
Some charts using World Health Organization numbers
At the end of last week, I thought I would put some charts together on the new coronavirus infections (nCov), and make some comparisons with SARS in 2003. These charts follow with a little description. I am, as you know, a "dismal scientist", not a medical person, so in what follows, I have tried to be as descriptive as possible, and allow you to draw your own inferences.
I have updated these charts with the latest World Health Organization numbers over the weekend (since I tweeted them last Friday).
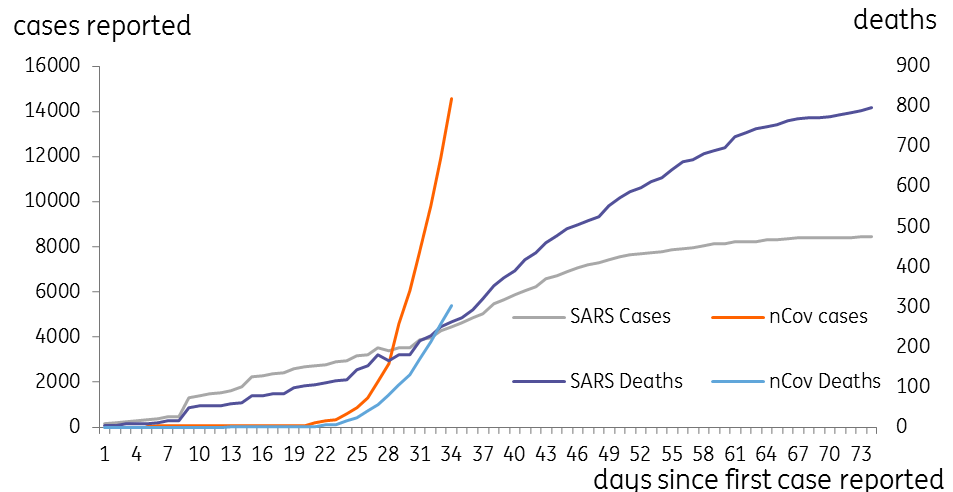
What the first chart shows is just how much more rapid the rate of infection of nCov is compared to SARS. And that even though the mortality rate from such infections is much lower, currently running at around 2%, it has already claimed more lives at the same stage following the outbreak, with the latest tally at 304 (more up to date and larger figures have been mentioned in the media, but I am waiting for the WHO to officialise them, so these figures could be a bit conservative).
nCov and SARS, a comparison

nCov cases and deaths
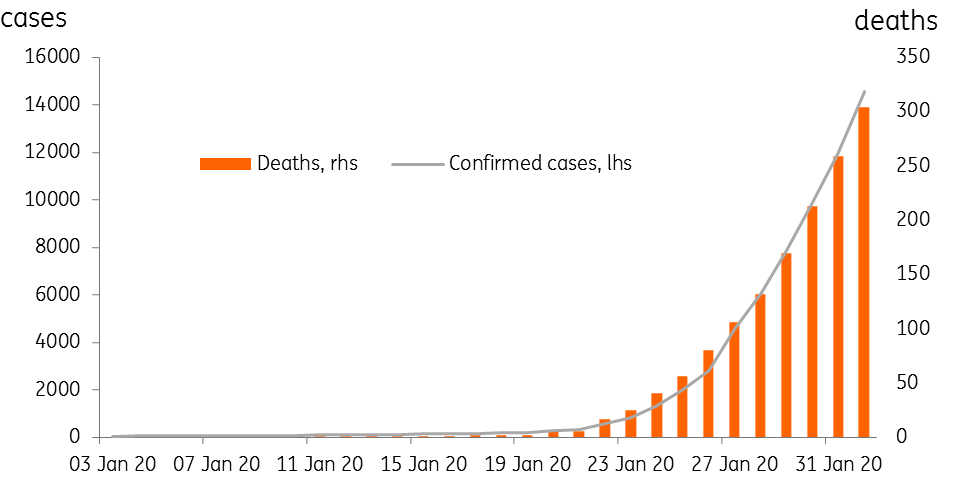
The next chart simply shows the numbers of confirmed nCov cases and deaths. The death rate is tracked on the right-hand axis and is a fairly steady function of the number of cases, lagging it slightly as you would expect.
Bear in mind that this disease was first noted by Chinese authorities on 30 December 2019. It is not until about 20 January, around two weeks ago that we start to see "meaningful" numbers of infections and deaths, about the same time markets and analysts like me, began to take a closer look at what this might mean. It is also around now that countries began to close their borders to passengers from Wuhan, following China's own quarantine of the worst affected cities.
Indeed, if you go back to about 17 January, when there were 174 cases, almost all of which were in China, we get to a similar position to where the rest of the world is today. To me, this begs the question, will the rest of the world be recording infections close to China's current rate in two weeks or so from now?
nCov cases and deaths

Where are the infections?
Chart number 3 shows where the infections are located, split by China, and the rest of the world. At this stage, that is detailed enough. There are 23 other countries affected, but although there are some instances of community transmission (i.e. person to person other than from Wuhan visitors), most of these have been from tourists from the Hubei region.
As the earlier chart showed though, you can move from very low case numbers up to much higher numbers in only a few weeks, so we are not drawing too many inferences from this just yet. I would say that it may be a bit too early to conclude that this epidemic has been contained within China. Though there may be some grounds for optimism.
nCov cases by location

New cases
One of the things markets are watching for with this epidemic is the rate of growth of new cases. With the SARS outbreak, the slowdown in the number of new cases was seen as a reliable indication that the disease was peaking out.
There were 2604 new cases noted in the WHO's latest situation report, up from 2127 the day before. That said, the growth rate seems pretty steady, not exponential, so possibly some of the containment effects are bearing fruit. For now, there is not much else for markets to take comfort from.
nCov, new cases, change from previous day

Asia week ahead - RBA, RBI, BoT, BSP
Besides nCov news, it is a busy week for the region, with plenty of central bank action. The Reserve Bank of Australia (RBA) is first up, and though most forecasters don't expect them to cut rates, I think there is a chance that we get a further cut from them. A combination of the impact of the bushfires and the coronavirus, plus a less-than-inspiring set of data make Governor Lowe's thesis of gentle upturn look questionable. A cut now, might not do much good, however, as low-interest rates lose their pep after a while. The more probing question would be, would it actually do any harm? If not, then about the only other argument for doing nothing is that the RBA is running out of ammunition and coming close to having to adopt unorthodox policy measures. For more on this, check out our latest Australia update.
The Reserve Bank of India (RBI) also meets this week. Following a very disappointing budget release over the weekend, many will be hoping for some additional easing from the RBI., They are likely to be disappointed, as Governor Das has already highlighted his concern over inflation risks. We have no rate cuts forecast for the RBI all year. They have already cut very aggressively (though ineffectively) last year, and the inflation backdrop is not conducive for any further action from them.
It's a different picture for the Bank of Thailand (BoT), where the Thai government still hasn't passed its budget yet after some voting irregularities last time, so the BoT is about all that the foundering domestic economy has to rely on. With Thailand's tourism industry reeling from the coronavirus, we can expect the usually reticent BoT to come to its aid with 25bp of easing this week.
And in the Philippines, we expect their central bank will provide some easing this week, with Governor Diokno continuing to sound a dovish note and suggesting 50bp of easing in total this year. That assessment may seem to conservative if nCov becomes entrenched outside China. Read this for more.
We also get a bunch of China data - Caixin PMIs and industrial profits today. I think it is safe to say that most of these will be ignored as not being up to speed with events on the ground. The PBoC's return to markets after the extended Lunar New Year holiday amounts to CNY1.2tr through its reverse repo operations. The net amount is not as large, as maturing reverse repos will mop up most of that, but it still marks a divergence from historical norms, when the PBoC normally soaked up funds released before the holidays. More could well follow in the coming days.
Download
Download opinion
3 February 2020
Good MornING Asia - 3 February 2020 This bundle contains {bundle_entries}{/bundle_entries} articles
Robert Carnell
Robert Carnell is Regional Head of Research, Asia-Pacific, based in Singapore. For the previous 13 years, he was Chief International Economist in London and has also worked for Commonwealth Bank of Australia, Schroder Investment Management, and the UK Government Economic Service in a career spanning more than 25 years.
Robert has a Masters degree in Economics from McMaster University, Canada, and a first-class honours degree from Salford University.
Robert Carnell
This publication has been prepared by ING solely for information purposes irrespective of a particular user's means, financial situation or investment objectives. The information does not constitute investment recommendation, and nor is it investment, legal or tax advice or an offer or solicitation to purchase or sell any financial instrument. Read more
