Why the US 10-year should settle in the 3% to 3.5% range
Has the US 10-year Treasury yield peaked? We’re not convinced and think it's likely to breach 3%, possibly within the next few weeks
Getting a good steer on the US 10yr Treasury yield is important, for a few reasons.
It is the global benchmark market rate; movements in it cause reverberations across rates and bond markets extending from core rates to corporates and emerging markets. Crucially, it also provides a long-term nose for where the Fed funds rate may eventually converge towards (compensated by term premium). So, it matters.
The big question is, has the 10yr rate peaked? We’re not convinced it has. Currently, 2.98%, we expect it to cross 3% perhaps within the next few weeks, with fundamentals, positioning and technicals as the key drivers. We employ our model for interest rates, to get an unbiased handle on a fair valuation of market rates.
The US 10-year rates since 1988 – still well below its historical average

What our model says?
We start by deciding where the neutral rate should be. Not an easy task, as it changes over time, and the average 10yr rate in the past 30 years at 4.85% is significantly different from current levels (some 200bp below average). We address this through the simple assumption that the US economy at the very least is a zero real rate economy, as Janet Yellen has attested. If that is the case, then the neutral rate must be flat to core inflation, and we expect core inflation to settle in the 2% area or slightly above.
The next thing to do is assess how far we should be deviating from this rate. To do this we look at how a selection of macro variables deviate from normality, and we translate that into a deviation from normality for market rates both based on historical distributions when normally distributed. Long story short, we find that a weighted average of current macro data points to a basis point deviation of +130bp, i.e. market rates should be some 130bp above normal based off contemporaneous inputs. So, with the neutral rate at 2%, we add 130bp to this to give 3.3%. That is then a target fair value for market rates; code for the US 10yr rate.
For the past six to nine months the model has been consistently pointing to an outcome in the range of 2.9% to 3.4% with most of the outcomes in the 3.2% to 3.4% area. At the extremes of this distribution, there is support for the 10yr holding at sub-3%, but the bulk of the distribution points squarely to a break above 3%.
The caveats to consider
This model is based on current macro data and is agnostic to how we got to where we are and is also ignorant of where we are going. It is just based on where we are right now and doesn't know for example that Donald Trump is the US president. So there is a layer of judgement that is required.
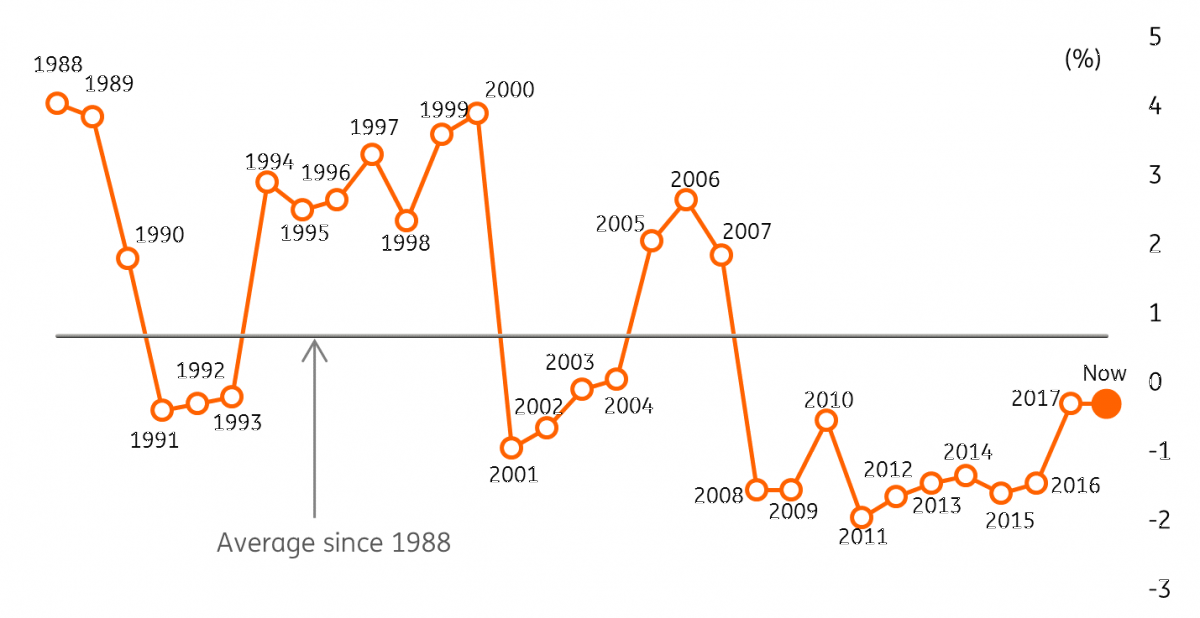
US Fed funds rate less core inflation – real rate still low and negative

Also, there is dynamism to take into account. For example, if core inflation were to drift up to 2.5%, that adds 50bp to the central outcome, as it immediately pushes up the neutral rate. The same goes for other macro variable moves. And we've side-stepped the debate as to whether the US is a positive real rate economy or not. If it is a positive real rate economy, that also places upward pressure on the neutral rate. Janet Yellen, for example, has asserted that the US economy will be a 1% real rate economy in the medium term – that immediately brings 3% into play as a future neutral rate.
There is also an important technical issue to consider – the unwinding of quantitative easing (QE). Throughout the third and fourth quarter this year we will move to a point where for the first time in five to seven years central banks will no longer be net buyers of government bonds as the QE is reversed, driven by the (gradual) unwinding of the Fed’s balance sheet. The Fed started to effectively de-print money late last year and will continue to do so through the coming five years at least; a persistent removal of support that had been in place through the years of aggressive central banks bond buying. Remember, even if we had a few weak macro datasets the quantitative tapering (QT) process continues relentlessly – an ongoing factor that places upward pressure on market rates.
But in fact, US fundamentals remain very robust. Consumer confidence is literally going off the charts, the last labour report had a jobs growth of 200k in excess of replacement, and survey evidence points to wage inflation ultimately heading towards 3.5%. While holes can and have been picked in aspects of the macro story, the fact remains that there is solidity in play in 2018 at least and well into 2019. We’d assert that the recession risk in the coming 18 months is very low but beyond that things, as always, become a bit fuzzy.
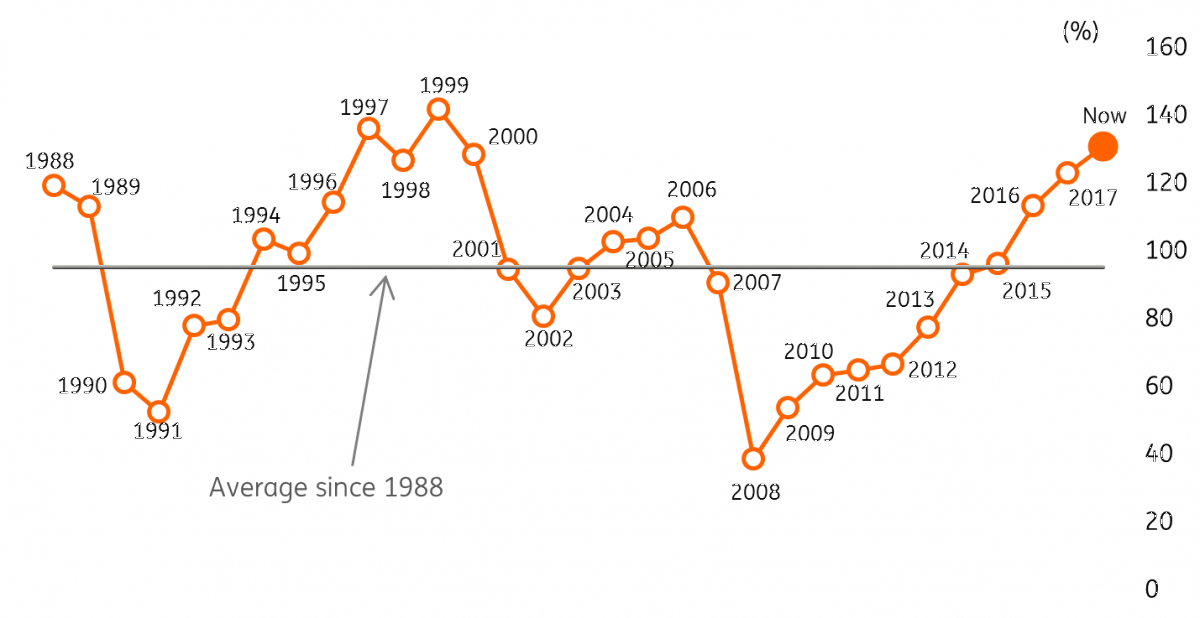
US consumer confidence – as high as it has ever been

This brings us nicely to key medium term considerations
One argument for not breaking above 3% is the likelihood that the US economy could slow, let’s say starting in 2020 as prior rises in the Fed funds rate begin to bite. This could occur against a backdrop where the fiscal deficit could be threatening a 5% handle as tax reform hits government revenues. And this added to a growing shortage of savings in the private sector could coincide with the deficit on the balance of payments heading towards a similar big figure. Therein lies the genesis of an imbalance that could well pre-empt a growth recession, likely necessitating eventual mild Fed cuts say from 2021.
Related to the long term, another item to consider is the long bond (30yr) yield. In days gone by this was the benchmark of the US yield curve, and still garners respect as a back-end anchor for the US curve. The point here is the long bond yield currently sits at 3.15%. By virtue of its tenor, the long bond yield has an ultra-long nose and is suggesting that US rates should not be getting much above 3%. We’d be having a very clear conversation on the logic of the 10yr breaking above 3% if the long bond yield was at 4% for example. Not as straight-forward where it currently is; accepted.
The counter-argument, however, is that fundamentals are just too bubbly to be ignored, plus the wage inflation/core inflation upside trajectory looks increasingly persuasive. That’s where our judgment lands. We are not convinced that the bond market sell-off is over. The long bond yield conundrum is more likely to be squared with the 10/30yr segment inverting at some point later in 2018. An inversion on the 2/10yr segment is less likely in 2018, reflecting a minimal imminent recession risk.
Market positioning is also an important input when it comes to timing and extent of the move. Around the turn of the year the flows data that we track show investors selling long end funds and buying short end funds, in order words they were shortening the duration and positioning for higher rates. That has calmed since, which in part explains why a subsequent break higher in the 10yr yield has not occurred, yet.
We expect this to change, likely to be bullied there by persistently firm fundamentals in the coming quarters. Chicken and egg kind of a situation, but all converging on a likely break above 3%.
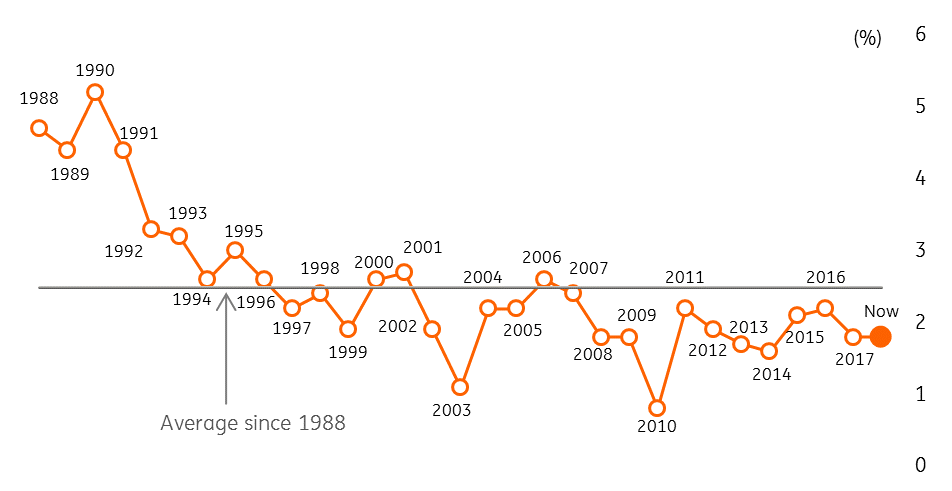
US core inflation – still well below historical average at 2.5%

But how high and for how long beyond that?
There is no firm evidence that the 10yr yield should break higher than 3.5%. We find that a material rise in core inflation to 2.5% would be required to make this happen. So not improbable, but not our base view. Hence the notion that the 10yr rate should settle somewhere between 3% to 3.5%. Our point estimate is 3.4%, which also helps project the prognosis that any break above 3% would be sustained for at least a few quarters.
To get above 3% in the first place, there needs to be a market discount where imminent inflation risks trump medium-term growth recession risks. And by the way, we see the Fed funds rate heading towards a terminal value towards 3% on similar reasoning. The end game, in fact, sees the curve flattening out completely with the three handle heavily in play.
Having marked these, subsequent rates moves would indeed then be lower.
This publication has been prepared by ING solely for information purposes irrespective of a particular user's means, financial situation or investment objectives. The information does not constitute investment recommendation, and nor is it investment, legal or tax advice or an offer or solicitation to purchase or sell any financial instrument. Read more
Download
Download article
23 April 2018
US: A milestone, a short squeeze and a Q1 conundrum This bundle contains 5 Articles
