What’s crackin’ in the refined products market?
Over the last month, refinery margins across regions have strengthened. Robust US gasoline demand, low middle distillate inventories and strong fuel oil demand have all proved supportive for margins. Moving forward, we remain constructive towards middle distillates, particularly in the US
US gasoline demand reaches record levels
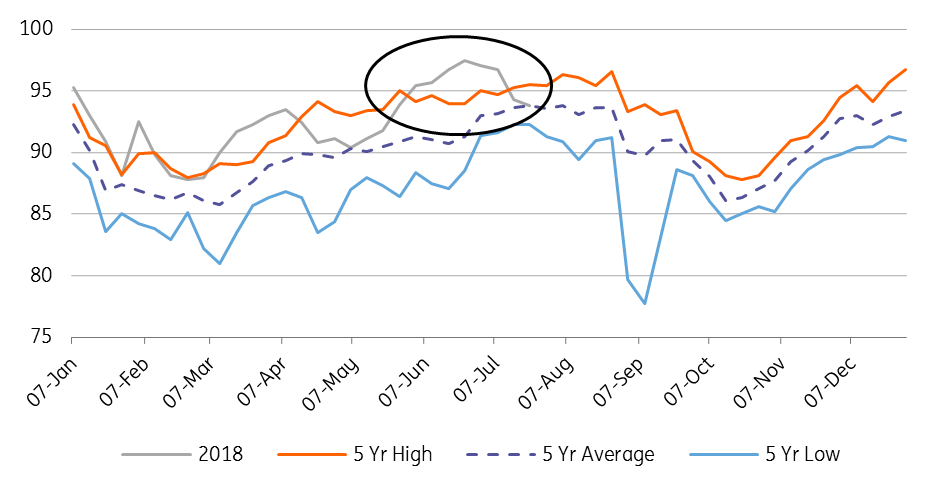
Having fallen from around US$23.50/bbl towards US$16/bbl over June, the RBOB crack has seen a partial recovery over July, trading back towards US$20/bbl. This recent strength is despite the fact US gasoline inventory levels stand at almost 234MMbbls, which is still towards the top end of the five-year range. The beginning of the driving season saw refiners in the country up utilisation rates to as high as 97.5% - a record high, and well above the five year average of 91.3%. At the same time, high gasoline stock levels in the ARA region, along with an open arbitrage supported the flow of gasoline from Europe to the US east coast. However with ARA gasoline inventories now back towards the five-year average, and European cracks strengthening we could see this flow slowing down somewhat moving forward.
In terms of US demand cover, gasoline inventories currently cover almost 24 days of consumption, while this number has averaged almost 26 days since the start of the year, slightly down over the same period last year.
It has been US gasoline demand which has supported the cracks recently. Weekly numbers from the EIA show that demand hit a record high of 9.88MMbbls/d for the week ending 8th June, while average demand since the start of May stands at 9.61MMbbls/d, marginally up from the same period last year. This robust demand is despite the fact that average national gasoline pump prices in the US have rallied by more than 20% over the last year.
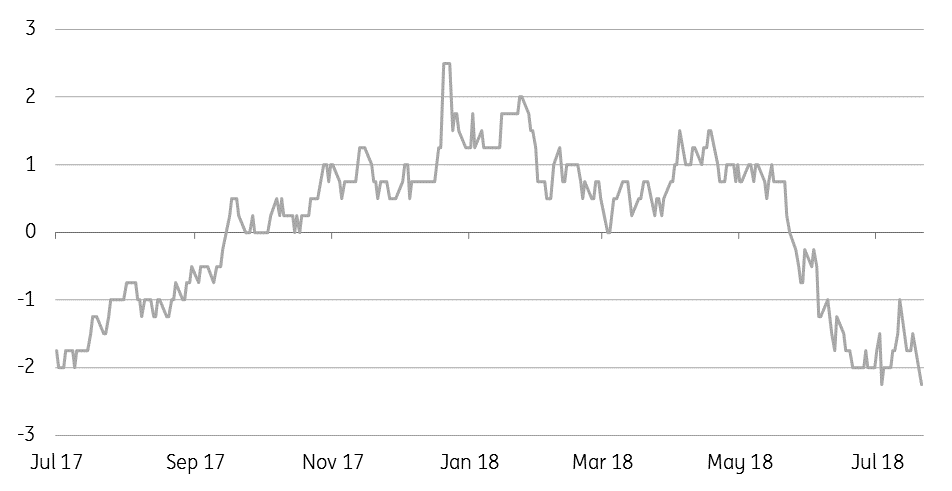
The growth in miles driven in the US is slowing. Between 2015 and 2017, monthly YoY growth rates averaged more than 2%. However since the start of 2018, this demand growth rate has slowed considerably to below 1%, and with the current price environment, there is little reason to believe why these growth rates will significantly increase moving forward.
With US gasoline inventories set to remain at comfortable levels, we wouldn't expect to see much more strength in the gasoline crack moving forward. The obvious risk to this view is if we do see an active hurricane season once again this year.
US refinery utilisation reaches record levels (%)

US miles traveled YoY growth vs.national average retail gasoline price

Gasoil supply looser for now in Europe
The ICE gasoil crack has had a volatile time, falling towards US$11/bbl in late June, only to bounce back towards US$15/bbl over July. This is despite ARA gasoil inventories growing over recent weeks. Meanwhile, the front end of the ICE gasoil curve remains in contango, suggesting the prompt market is fairly well supplied.
Flows from the US to Europe have been strong, with Bloomberg tanker tracking showing that 1.48mt tonnes arrived in June, and for July flows are expected to total a little over 1.8mt, which would be the strongest number since August last year. Stronger arrivals have helped see a recovery in ARA gasoil inventories, with them having increased by almost 390kt since the end of June to total 2.39mt. However, this is still some distance away from the five year average of 2.8mmt at this stage of the year.
Meanwhile, Bloomberg tanker tracking also shows that Indian flows into Europe of diesel and jet fuel are expected to total almost 730kt, which would be the largest monthly flow since at least December 2016. While flows from the Middle East to Europe are also set to be higher MoM for July.
Low water levels along the Rhine are also likely playing a role in the recent build-up of gasoil inventory in the ARA region, with barges forced to carry lighter loads.
The shape of the ICE gasoil forward curve is also looking less attractive for speculators, with the front end having flipped back into contango. Since the end of May, speculators have reduced their net long position in ICE gasoil from a record 215,304 lots to 137,464 as of last Tuesday. The reduction in this positioning has been driven almost exclusively by longs liquidating, rather than fresh shorts entering the market. With the recent build-up in ARA inventory and the fact that the front end of the curve remains in contango means that speculators may be more reluctant to rebuild their net long to the levels seen earlier in the year.
In the immediate term, European gasoil cracks could come under renewed pressure as a result of the above changes, however, in the medium term we believe the outlook remains constructive for cracks in the region.
ICE gasoil Aug/Sep spread moves deeper into contango (US$/t)

US middle distillate inventories remain tight
In the US, distillate fuel oil inventories remain below the five year low, but despite this, heating oil cracks have fallen significantly since early June- from around US$26/bbl to US$22/bbl currently. The summer months are seasonally the low point for demand, however robust manufacturing activity and exports have meant that stocks are not rebuilding as quickly as they have in the past. Based on weekly EIA data, distillate fuel oil exports so far this year have averaged 1.21MMbbls/d, up almost 100Mbbls/d over the same period last year. Inventories currently stand at 121MMbbls, down from around 154MMbbls at the same stage last year. While if we look at how many days of demand cover there is, current inventories will fulfil less than 30 days consumption, in fact, the number has averaged a little over 31 days over the course of this year, compared to almost 39 days over the same period last year.
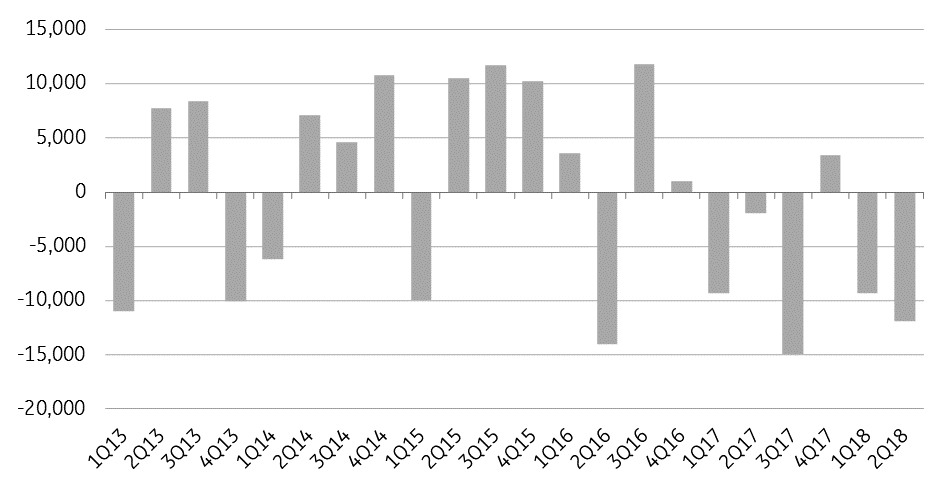
However, as we move through the year, we would expect the YoY inventory difference with 2017 to narrow, given the fact that we saw significant draws in refined product inventories last year with refinery outages as a result of an active hurricane season. In 3Q17 distillate fuel oil inventories fell by 15MMbbls, this compares to stock builds of closer to 11.7MMbbls in 3Q15 and 3Q16. While over 1H18, US inventories have fallen by a little more than 21MMbbls, which is the biggest draw since 1H12. One thing is clear, the US will need to build inventories over Q3, and they are on course to do this, with them increasing by almost 3.7MMbbls since the start of the quarter, but still lower than a five-year average build of 4.4MMbbls over the same period.
We generally remain constructive towards middle distillate cracks, inventory levels in the US, Europe and Asia remain below the 5-year average, and as we move into 2019, the market will increasingly focus on the impending IMO shipping changes, which will see a significant shifting of demand from high sulphur fuel oil to middle distillates.
Quarterly changes in US distillate fuel oil inventories (Mbbls)

Fuel oil cracks soar
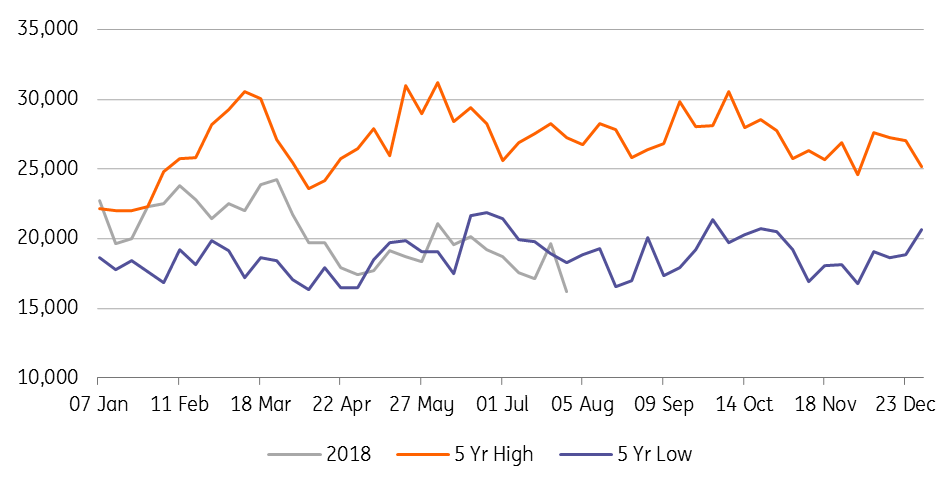
The fuel oil market has been strong as of late, cracks have strengthened significantly, particularly in Asia, with the 180cst/Dubai crack strengthening from a discount of over US$7/bbl in April to flat in July. Part of this strength is a result of flows from the Middle East having slowed with a seasonal pick up in domestic demand for cooling. In Singapore, fuel oil inventories have fallen to 16.2MMbbls, well below the five years low, and also the lowest number seen since 2012. Flows from the Middle East should pick up following the summer months, which should mean a weaker crack.
Demand prospects in Asia also look more constructive as a result of China. Earlier in the year, the Chinese government became stricter with tax enforcement on independent refineries, which has weighed heavily on their refinery margins. This is very clear when looking at run rates for independent refineries which have fallen from 68% in March to as low as 54% over periods of July. Refinery margins have looked better when using fuel oil as a feedstock, and as a result of this, there are reports that some independent refineries are switching back to fuel oil. Looking at import data, fuel oil imports between the months of March-May were 16% stronger YoY. However, June import data was fairly poor, suggesting that we do not see a significant shift just yet. However, this is possibly something to watch later in the year when the fuel oil supply from the Middle East is expected to increase.
Singapore fuel oil inventories fall to multi-year lows (Mbbls)

Download
Download articleThis publication has been prepared by ING solely for information purposes irrespective of a particular user's means, financial situation or investment objectives. The information does not constitute investment recommendation, and nor is it investment, legal or tax advice or an offer or solicitation to purchase or sell any financial instrument. Read more
