US manufacturing outlook: Better times are coming
The US economy as a whole has been consistently surprising to the upside, but the manufacturing sector has been languishing. Even so, a growing belief in a soft landing and the potential for significant interest rate cuts could bring renewed vibrancy to the sector. Politics, trade and policy missteps are all potential threats to be aware of


US manufacturing sector composition
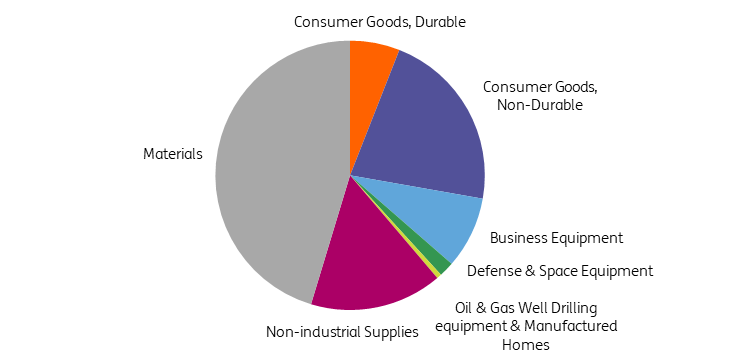
US manufacturing is a highly diversified sector that contributed $2.9tr to GDP in 2023, equivalent to just over 10% of all economic output. It also employed 13 million people, accounting for 8.3% of all US jobs. The sector can be split into two broad groupings. Firstly, there is final products & non-industrial supplies, which represents 54% of manufacturing output and includes the likes of cars, furniture and computers. The other 46% are classified as “materials”, which includes the production of items such as textiles, paper, steel and manufactured parts that go into the former category of final products.
Breakdown of the US manufacturing sector
Note: consumer durable goods are goods that should last more than 3 years, such as vehicles and household appliances. Non-durable consumer goods include food, energy products (gasoline, heating oil, etc), clothing and cleaning products. Business equipment includes items such as transit vehicles and industrial equipment Non-industrial supplies include construction sector and regular business supplies.
Pandemic plunge followed by a 2021 rebound
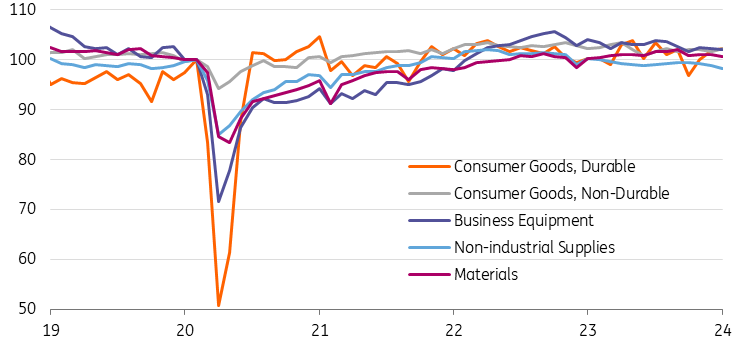
The Covid pandemic heavily disrupted the US manufacturing sector, with output falling nearly 20% between February and April 2020 as the economy went into lockdown. Lingering supply chain disruptions resulting from Covid containment measures plus strained freight capacity both at home and abroad meant that it wasn’t until November 2021 that output volumes fully recovered.
US manufacturing output volumes Feb 2020 = 100
Nonetheless, in an environment of strong consumer demand for physical goods – caused by fiscal support via stimulus payments and extended and uprated unemployment benefits, plus cheap financing conditions – pricing power increased significantly for manufacturers and profitability generally increased. With the ability to spend money on leisure and hospitality severely constrained, retail sales swung from taking 42% of all consumer spending to 47% in just a couple of months.
Tougher times since 2022
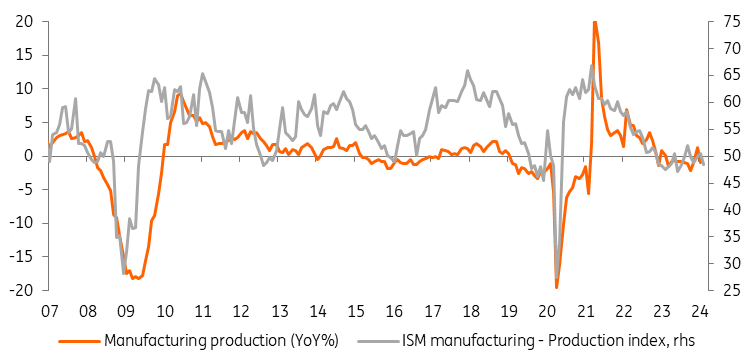
The situation has changed significantly over the past two years, with official data showing that manufacturing output has stalled since early 2022. The Institute for Supply Management’s (ISM) widely watched manufacturing survey is even more downbeat, indicating contraction for 16 consecutive months.
US manufacturing output versus ISM manufacturing production index
The full re-opening of the economy saw consumers shift away from spending so much on physical goods to spending more on leisure, travel and purchasing “experiences”. This resulted in consumer spending rebalance back towards pre-pandemic trends whereby services accounted for a much higher proportion of overall consumer spending.
Tighter financing conditions weigh on demand
The US economy has also experienced the most rapid and aggressive monetary policy tightening cycle for more than 40 years, while the rapid tightening of credit conditions in the wake of last year’s bank failures have provided another constraint on businesses and their customers.
Car loan borrowing costs are currently at 23-year highs and credit card borrowing costs are at all time highs (data back to 1972). At the same time, high mortgage rates have depressed housing transactions, so they are close to the lowest levels since the early 1990s when the US population was around 70 million fewer than it is today. This is an important story, as housing transactions correlate strongly with demand for consumer durables such as furniture, furnishings and home appliances. After all, buying a new home is usually accompanied by the purchase of new items, so this has been a headwind for manufacturing.
December 2023 saw broadest manufacturing weakness since the financial crisis
In December 2023, just 1 industry out of 16 industries (as categorised by the ISM) reported growth – namely primary metals. The report added that “84 percent of manufacturing gross domestic product contracted in December, versus 65 percent in November”. This was the broadest weakness seen since the Global Financial Crisis when for three months zero industries reported growth – even during the worst point in the pandemic in April 2020 there were still two industries reporting growth.
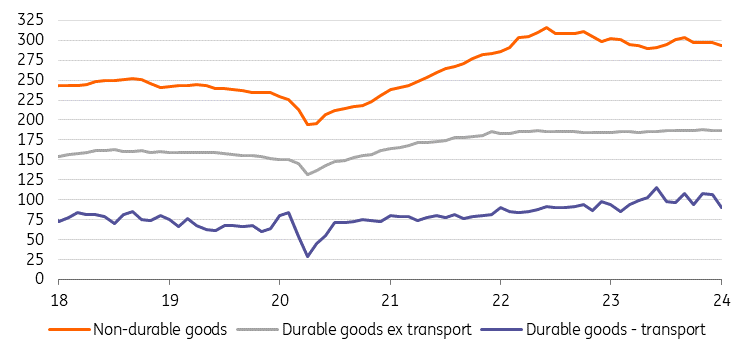
Business investment has also been disappointing and this has been a major factor behind official factory order numbers flatlining. The chart below shows that transport orders (largely cars and aircraft) are the only area to have seen ongoing robust gains, although note recent weakness here too. Non-durable goods, such as food, textiles and chemicals have been drifting lower. These numbers are in dollar terms so given high inflation readings, it implies order volumes are down. In turn, this suggests that the manufacturing sector production will remain subdued over coming months.
US manufacturing orders US$bn
2024 starting on a firmer footing
The story isn’t all doom and gloom, however. The January ISM manufacturing index was better than expected with its new orders rising above the break-even 50 level, the threshold indicating expansion, for the first time since August 2022. The headline new orders index slipped a little in February, but we are seeing a broadening out of improvement, with 61% of industries reporting growth versus 28% in January.
This may be tied to the decline in market borrowing costs in late 2023, receding recession fears and signs that banks are increasingly willing to lend to the sector. Financial markets anticipate that the Federal Reserve will be in a position to cut interest rates later in 2024, which may help facilitate a “soft landing” for the economy rather than a painful recession. At the same time, corporates are in robust shape with healthy balance sheets and are producing decent earnings numbers, so they appear a much better proposition to lend to than commercial real estate and consumer loans where delinquencies are on the rise.
The chart below shows that the Federal Reserve’s Senior Loan Officer Opinion survey has a good lead quality for the year-on-year change in outstanding bank lending for commercial and industrial loans. It suggests that, with banks more willing to lend to the sector at lower interest rates, lending growth to corporate America is likely to turn positive in the second half of the year.
Banks willingness to lend to the sector is on the rise

Better lending conditions could boost investment substantially
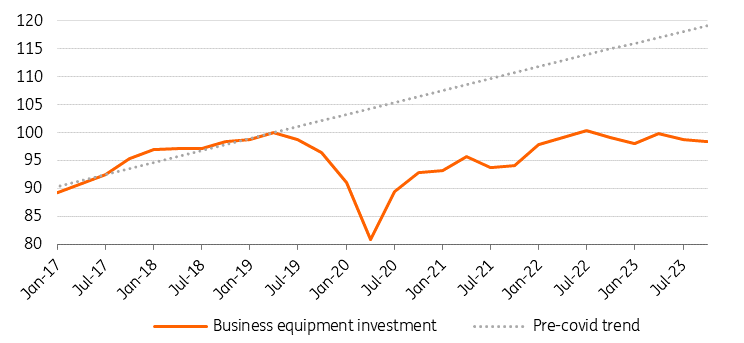
This is an important story, because one of the few areas of disappointment in the US growth story over the past 18 months has been the weakness in business capex spending. The chart below shows what has happened to the real level of business investment on equipment. In nominal terms, this totalled $1.38tr in 2023. Given the underperformance relative to trend and accounting for inflation, there is scope for this to rebound by more than 25% over the next couple of years, equivalent to an extra $350bn of investment spending on industrial, IT, transport and other equipment. Greater clarity on the economic outlook, lower borrowing costs and increased bank willingness to lend would be helpful in achieving that.
Business equipment investment has been a real weak spot for the economy (Volumes 2Q2019 = 100)
Manufacturing output set to grow 1.5% in 2024 and 3% in 2025
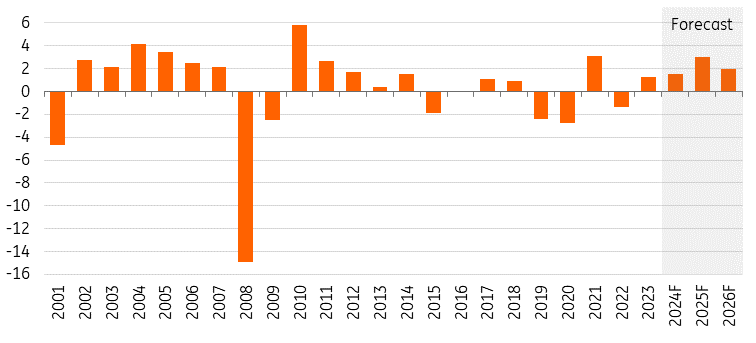
Given an environment of a soft landing with lower interest rates and a slightly weaker dollar coinciding with rising business confidence and rising investment spending, we forecast manufacturing output increasing 1.5% in 2024, with a 3% increase in 2025 before settling back to 2.5% growth in 2026. Nonetheless, there are risks – be it political, geopolitical or financial – that mean uncertainty over these projections are high, both to the downside and the upside.
ING's forecasts for US manufacturing output (YoY%)
US elections shouldn’t impact growing tech and infrastructure investments…
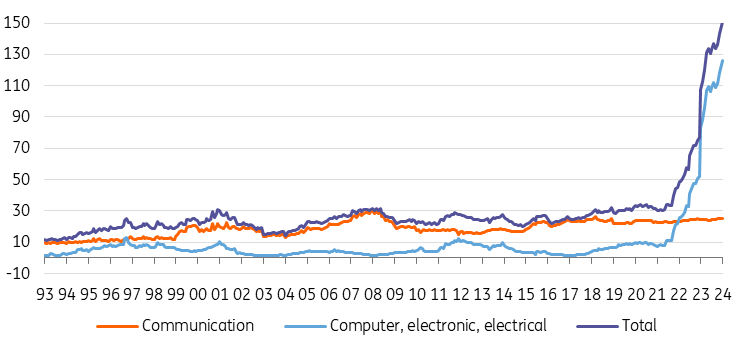
President Joe Biden’s incentives to re-shore semiconductor manufacturing through the CHIPS Act of 2022 (Creating Helpful Incentives to Produce Semiconductors) have been highly effective, prompting a sharp increase in construction of chip fabrication plants via tax credits. This has been supplemented by the Innovation and Competition Act that authorised $110bn for technology research. Both acts are designed to help the US economy and the US military compete more effectively in response to fears of an intensifying global tech/AI war and point to strong growth ahead in high tech manufacturing.
Government support for the sector is set to remain in place, irrespective of the outcome of the November elections. Democrats and Republicans both want to keep the US leading the world in technological innovation while also protecting national security.
Construction spending related to communication versus spending relating to computer & electronics sectors (US$bn)
Additionally, the Infrastructure Investment and Jobs Act (IIJA) of 2021 aims at expanding the construction of public roads, EV infrastructure, broadband, water, and so on – although actual spending has been increasing at a more moderate rate than that under the CHIPS Act. Nevertheless, the IIJA is expected to spur more construction activities through 2026. This should, by extension, boost the manufacturing of required materials and subsequently lead to higher manufacturing activities of final products.
…but funds for clean energy investments might come under pressure
The Inflation Reduction Act (IRA), with hundreds of billions of dollars of funding and tax credits dedicated to the energy transition, has led to a surge in clean manufacturing investment. There had been $36bn of new planned utility-scale clean energy manufacturing investment (excluding planned investment in projects and supply chain agreements) during the first 18 months of the IRA being signed into law. During the first year of the IRA becoming effective, there was $72bn of EV value chain manufacturing investment.
However, both the IRA and the clean energy part of the IIJA risk policy disruption after the November elections. The two acts may not completely disappear even under a Republican administration because of the potential economic benefit and job creation. But their financial incentives can be scaled back, and implementation rules can get stricter. This means that the positive effect these acts would bring to the manufacturing industry may become relatively lower in 2026 and beyond. Moreover, even if President Biden wins a re-election, additional support over and above what has already been announced is likely to be limited by significant government debt levels and high borrowing costs, pressuring authorities to look at ways of saving money.
Trade policy could increase barriers
A key concern for the manufacturing sector is the potential for a re-escalation of trade tensions. Former US president Donald Trump introduced significant tariffs on some Chinese products during his term of office while also re-negotiating trade with Canada and Mexico and pulling the country out of his predecessor Barack Obama’s Asia trade deal, the Trans-Pacific Partnership.
President Biden has maintained many tariffs as well as import bans, such as those on Chinese solar panels. He has also examined the possibility of implementing other tariffs, i.e., on Chinese electric vehicles. Non-trade related sanctions have also been put in place during his presidency to try and slow Chinese technological and economic development, and these have been justified as a response human rights and security concerns. If President Biden were to be re-elected, there is reason to doubt that tariffs will be increased – but the non-tariff sanctions may be slowly extended and expanded.
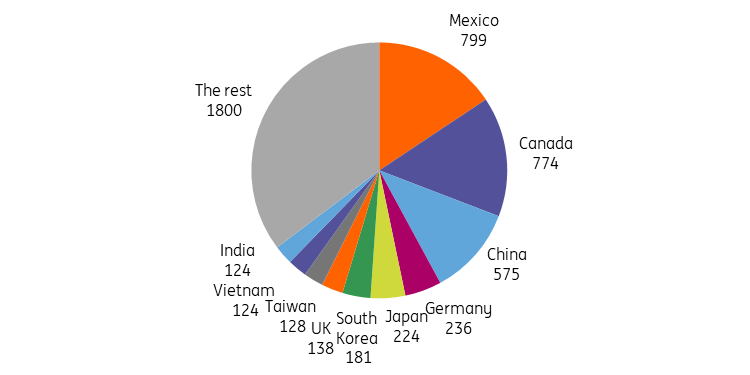
Total US trade (exports plus imports) by country in 2023 (US$bn)
Trump initiated tariffs on steel and aluminum imports in 2018 under Section 232 of the Trade Expansion Act of 1962. This law allowed the president to raise tariffs on imports that pose a threat to national security without having to win the approval of Congress. As the likely Republican Party candidate, Donald Trump has proposed a 10% tariff on all US imports, with 60% tariffs on Chinese imports, as part of his election campaign. However, he may need Congressional approval this time around for such broad-based implementation of tariffs. There is likely to be opposition from both sides within Congress, with the strong prospect of retaliatory tariffs from trade partners. Consequently, there is a chance the proposals are watered down.
While blocking Chinese competition may help the US auto sector, 10% tariffs would significantly inflate costs in most industries and could end up hurting US exporters if we see tit-for-tat reprisals from trade partners. In 2023, the US exported around $1.8tr of manufactured goods, the largest categories being automotive and parts ($180bn), civilian aircraft, parts and engines ($130bn), pharmaceuticals ($100bn) with chemicals and technology-related products also making significant contributions. The US imported around $2.8tr of manufactured items, including $440bn of automotive vehicles, parts and engines, $90bn of computers, $100bn of civilian aircraft, parts and engines, $120bn of cell phones and $200bn of pharmaceuticals.
The aim would be to boost US manufacturing competitiveness and this could marginally incentivise re-shoring, but any shift in the production base is going to be costly in the near-term and could lead to rising inflation over and above that implied by tariffs alone. This will have knock on effects more broadly for the US economy. Depending on the scale of retaliation, it could also be economically damaging, particularly for major exporters such as aerospace and food producers – a sector China specifically targeted in 2018-2020 in response to US tariffs on steel and aluminum.
A 10% tariff on $3tr of imports implies a tax hike equivalent to $300bn for the manufacturing sector to bear. Consumers will end up paying the bulk, but it will be painful for many manufacturing with some squeeze on profit margins likely amongst both producers and retailers. Looking more broadly, the US economy is $28tr in size and tariff costs to the tune of around 1% of GDP will be a headwind. How much of a headwind depends on what the government chooses to do with those revenues. Will it be used to purely shrink the deficit or will we see taxes cut elsewhere?
Middle East tensions could prove disruptive, but less of a threat to US manufacturers versus Europeans
Another thing that we are watching for the sector is what is happening in the Middle East. Trade is being disrupted by Houthi attacks on shipping, but the US should, in theory, be less impacted than European manufacturers. The US only takes part in a modest amount of trade directly with the Middle East and North African nations, of little more than $200bn in total trade flows (exports plus imports). More significantly, most trade with Asia goes via the Pacific, so there is not going to be the disruption that Europe faces on its trade with Asia through the Red Sea.
That European trade is increasingly being diverted around the Horn of Africa rather than through the Suez Canal. This means longer shipping voyages in aggregate and less efficiency, which is bidding up the cost of chartering vessels, even on the US-China Pacific route. These are additional costs that US companies will have to bear, but there will again be winners and losers since US companies with a full supply chain in the US or the Americas will have little issue.
Energy security puts US manufacturers at a relative advantage
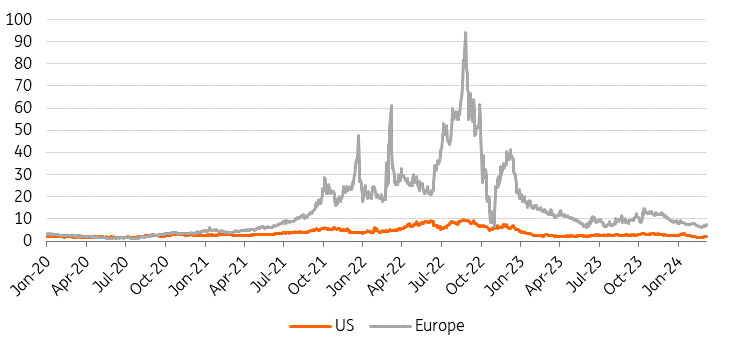
Energy costs have also been a factor that have helped US manufacturers at the expense of European producers in recent years. Concerns about the loss of Russian oil and gas supplies and the potential for energy shortages saw European prices spike higher, with worries that governments could insist on manufacturing plants being shut down to ensure there are enough supplies for households. Europe has admittedly been very successful at switching suppliers and subsequently prices have moved lower, as the chart below shows.
Somewhat surprisingly, even with heightened geopolitical tensions in the Middle East, we are not seeing a renewed spike in prices. Europe still pays more than the US does, which has abundant domestic supplies of natural gas, but the relative advantage that US manufacturers enjoyed versus European manufacturers between mid-2021 and mid-2023 looks to be diminished. Nonetheless, having security of energy supply remains important for when planning where to put manufacturing facilities over the long term – a clear advantage for the US.
US versus Europe natural gas price ($/MMBtu)
Hard landing versus soft landing could spell disaster
Our projections in our base case assume a relatively benign macro backdrop of a cooling economy, moderating inflation and gradual interest rate cuts that takes monetary policy to a more neutral footing, with a Fed funds target rate of around 3-3.25% by mid-2025. However, a soft landing for the economy is not guaranteed.
A “hard landing” for the economy cannot be ruled out. One way this could happen is if the Federal Reserve errs on the side of caution to ensure inflation falls to 2% and keeps interest rates higher for longer. 10Y Treasury yields would rise back towards 5% in this environment, pushing up borrowing costs for households and businesses. This would dampen activity, and it’s likely that loan defaults would rise – credit card delinquencies have already risen from 4% to 8.5% and could potentially rise to GFC levels of 12%, while car loan delinquencies are also picking up. In addition, commercial real estate (CRE) loan losses would mount, which reignites concerns about small bank solvency in the US the economy. Credit conditions would tighten significantly and, coupled with high borrowing costs and asset price declines, this could potentially result in the US economy falling into a deep recession.
This scenario would undoubtedly be very bad news for the US manufacturing sector, prompting a sharp downturn in orders and a pullback on corporate investment spending. By way of reference – and very much a worst case scenario – manufacturing output fell 21% between December 2007 and June 2009 as the Global Financial Crisis hit hard. Manufacturing output remains more than 9% below that 2007 peak level today.
Download
Download articleThis publication has been prepared by ING solely for information purposes irrespective of a particular user's means, financial situation or investment objectives. The information does not constitute investment recommendation, and nor is it investment, legal or tax advice or an offer or solicitation to purchase or sell any financial instrument. Read more