US Housing: As good as it gets?
- 5 November 2018
- United States
Despite a red-hot economy, the US housing market looks decidedly lukewarm. Unless construction picks up, slowing residential investment will start to drag on GDP growth

The market has stalled since the start of the summer
Sales of existing homes have fallen to 5.15m (annualised) in September, the lowest level for two years, down from an average of around 5.5m at the start of the year. New home sales have also been falling, with only 515,000 new homes sold in September, compared to 650,000 on average in Q1. Having said that, pending home sales in September increased slightly, suggesting sales may pick up a little in Q4.
Housing looks to be turning into a headwind for the US economy, with flat or slowing construction spending over the next year or so increasingly likely
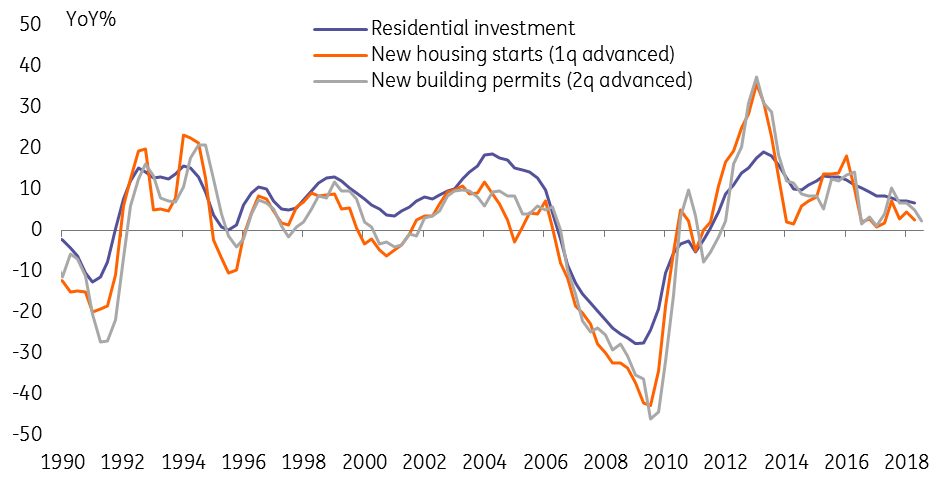
New construction looks similarly lacklustre, with new starts stalling around 1.3m annualised since 4Q17. June and July were particularly weak for housing starts, which may be partly related to the extremely hot weather – 2018 saw the hottest summer since the 1970s. But new building permits (which are less affected by weather effects) have also flatlined in 2018, indicating construction is unlikely to pick up soon.
Residential investment slowing as pace of new starts and permits growth slows
Affordability is worsening
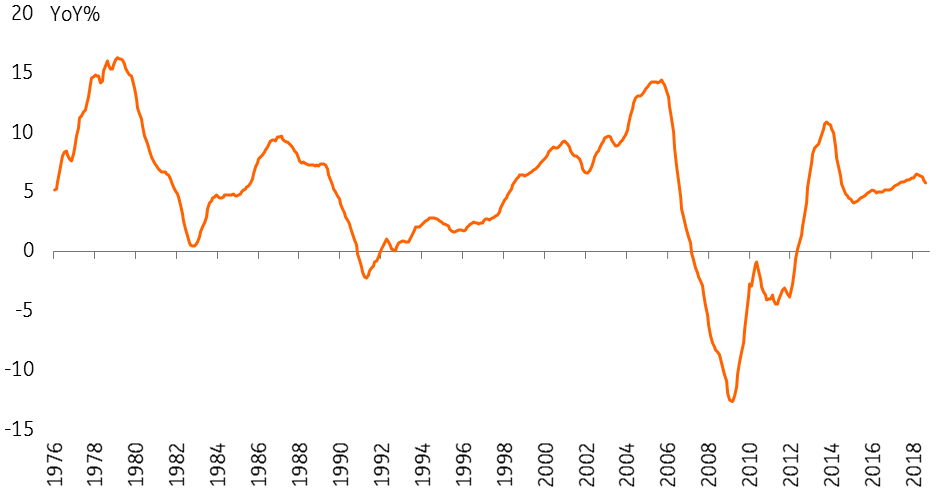
Average house prices are still rising at a healthy clip (5.8% year on year according to the S&P Case-Shiller index). But the pace of price increases has fallen back somewhat this year, and that may well continue into 2019. The slowdown widespread: 15 of the 20 cities covered by the S&P index saw slower price growth in the latest data from August.
Affordability constraints are clearly starting to bite. Potential homebuyers now face materially higher interest rates – effective mortgage rates on a standard 30-year mortgage have risen above 5%, and are up by around 100bps in 2018, roughly half of which is due to the rise in long-term Treasury yields and the other half to a higher spread between Treasury yields and mortgage rates. Also, tax changes have reduced the incentives for homeownership, and increased the cost considerably for some (those owning or buying high-value homes in states with high property taxes).
US national house price index
And inventory has started to increase
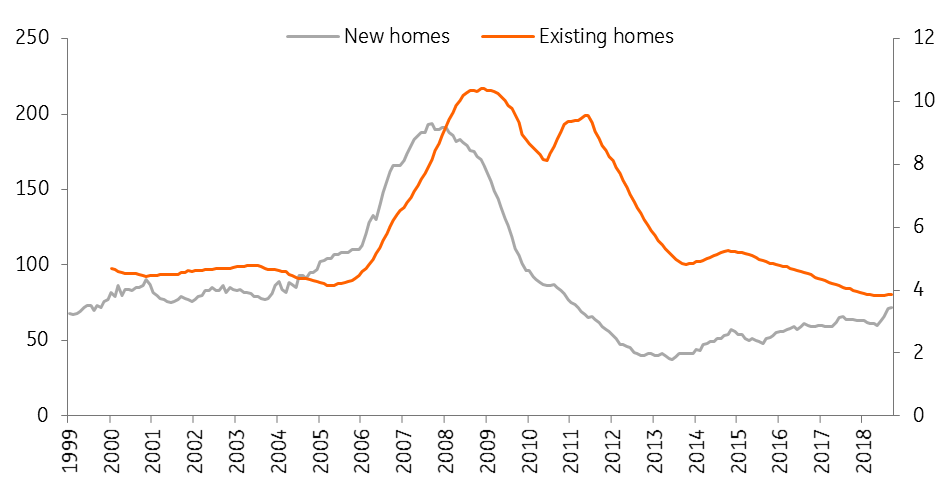
Another indication the market is less buoyant is the increase in inventory (existing homes available for sale), which has ticked up to 4.4 months’ worth of sales – inventory is highly seasonal, but inventory over the past three months was higher than at the same time last year. While these are still historically low levels of inventory, it is significant that the downtrend over the past few years has been broken.
At the same time, inventory of new homes has risen more markedly and is nearing the pre-crisis average. There is anecdotal evidence that some locations may be facing significant oversupply, especially of relatively expensive newly built apartments. We think it is plausible that American cities which have seen the most dramatic rise in prices and construction over recent years (the likes of NYC, Boston, Denver, Seattle, and San Francisco) could experience a price correction. This would be similar to what has already happened in large cities in Canada, Australia, Sweden and Norway, where house price inflation and construction has been very fast in recent years and oversupply, and stretched valuations are now putting downward pressure on prices and sales.
Supply of available for sale homes
What does it mean for the wider economy?
Now, none of these data points by themselves suggest a sudden slowdown is imminent. But taken together they do paint a picture of a slowing housing market that may have reached the limit for the current expansion or, at best, could see sales and construction inch up a little more over the next few quarters. But the best part of the housing expansion looks to be behind us, and even our relatively conservative assessment earlier this year now looks to have been too optimistic.
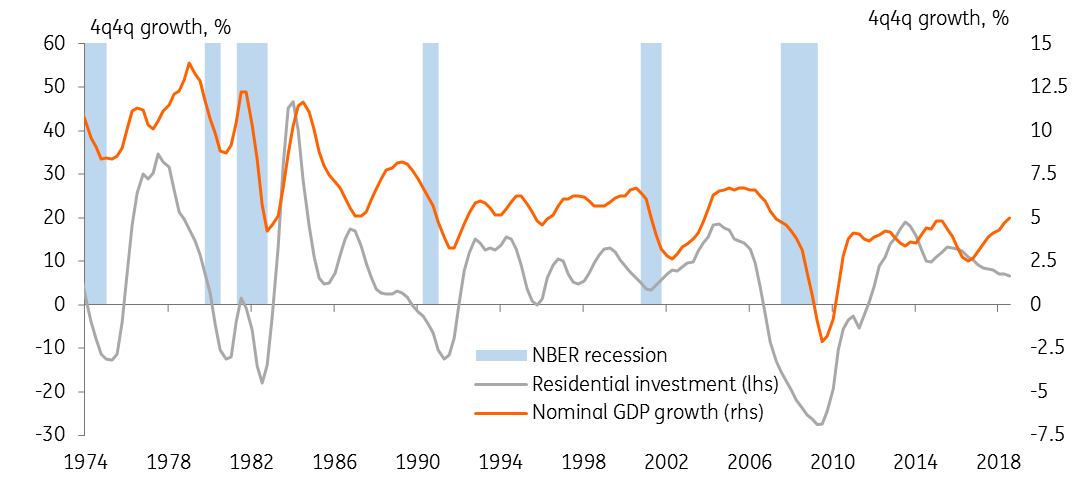
This is important because historically housing has been a key driver of the economic cycle. The most obvious example, of course, is the housing market meltdown ahead of the Great Recession in 2007-09. But residential investment has been a decent predictor for an economic slowdown for much of the post-war period.
The current situation, where GDP growth has accelerated over the past year or even as residential investment has been slowing down, is pretty unusual. One reason for the divergence is probably the tax bill passed late last year, which has boosted the overall economy but arguably was a net negative for the housing market. We’d expect this divergence to close gradually, with GDP growth slowing somewhat over coming quarters.
The bottom line is that housing looks to be turning into a headwind for the US economy, with flat or slowing construction spending over the next year or so increasingly likely. This is consistent with our expectation that the pace of US growth will moderate in 2019.
Growth in residential investment and GDP has diverged
Content Disclaimer
This publication has been prepared by ING solely for information purposes irrespective of a particular user's means, financial situation or investment objectives. The information does not constitute investment recommendation, and nor is it investment, legal or tax advice or an offer or solicitation to purchase or sell any financial instrument.Read more
Included in the following bundle
In case you missed it: Trump 2.0
- This bundle contains 7 Articles