Trump: The destroyer of economic relationships?
- 1 August 2018
President Trump’s penchant for shaking things up has evidently, although presumably not intentionally, spread to data relationships. What is causing this and will things ever return to 'normal'?

Great is good, fantastic is better…
Last Friday’s 2Q GDP report was obviously great. The 4.1% annualised growth figure was the strongest recorded since 2014 and suggests that the economy is reaping the benefits from the tax cuts enacted last December. However, surveys suggest that growth should have been even stronger. 'Great' growth is good, but 'fantastic' growth would have been much, much better.
A notable breakdown in historically strong relationships
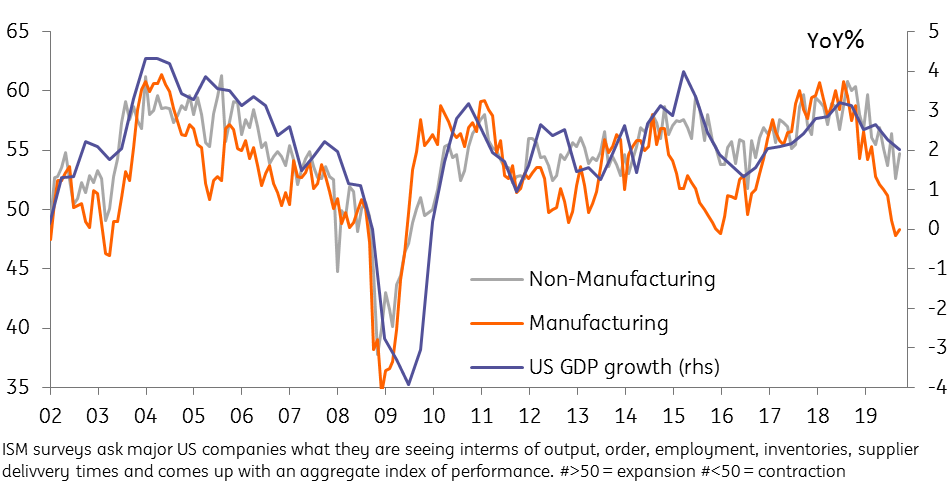
Since President Trump’s election, there's been a notable break down in historically strong relationships between official activity data and third-party surveys. For instance. the ISM manufacturing index has been asking businesses what they are experiencing in terms of orders, output and employment for the past 70 years and it's arguably been the best lead indicator for GDP growth in the coming quarter. However, rather than agreeing the economy is growing around 4%, it is at levels historically consistent with GDP growth of nearly 8%.
ISM manufacturing index suggests GDP growth could have been even stronger
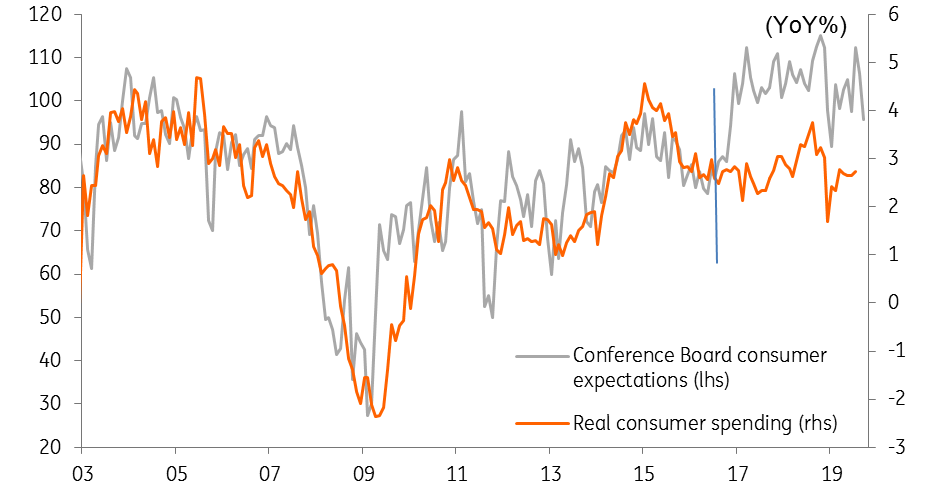
We can see a similar relationship break down between the Conference Board measure of consumer confidence and real consumer spending growth. As the chart below shows, consumer spending has grown at half the rate that the historical relationship with consumer spending suggests is achievable.
Consumer confidence suggests spending could have been stronger too
There have been divergences between sentiment and spending in the past, but they tend to last just a few months rather than the best part of two years. Instances include Hurricanes Rita and Katrina, which depressed sentiment briefly in 2005, but Federal relief spending helped support consumption and we saw confidence quickly recover. Sentiment also plunged in 2011 after rating agency S&P downgraded the US from AAA status amid worries about a government shutdown. However, the shutdown was averted and sentiment recovered with little impact on consumer spending overall.
Is it different this time?
The divergences since late 2016 appear to be far more structural than those previous instances, so what is going on? Well, we know the ISM generally follows the economic cycle, so we look at news on things such as orders and employment when trying to forecast this series. We also look at what is happening to the global economy and the lagged effects of currency movements to see if the US is becoming more or less competitive on the international stage.
As for consumer confidence, we know that employment levels, pay rates, and the pace of inflation all act as key drivers. However, we also note that changes in prices of highly visible goods, such as gasoline and food, have disproportionally large effects while asset prices – primarily equity and house prices – are also important swing factors.
External factors, such as natural disasters, can also lead to shifts in both business and consumer surveys while tax changes can also make households and businesses more positive on their personal situation.
Are the surveys offering 'fake news' or is it down to President Trump's policies?
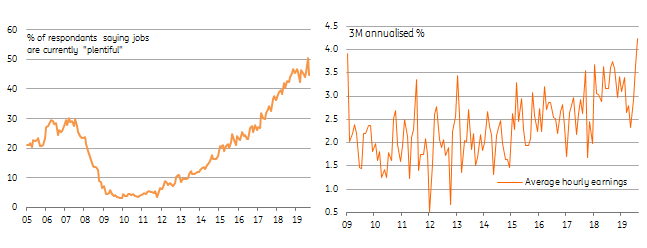
Looking at the current juncture, employment is strong, the economy is robust, asset prices are high and tax cuts are feeding through the system. These are all clear positives for consumer confidence and the ISM survey. However, there are worries about trade wars and their economic implications. At the same time wage growth is modest and is flat when adjusted for headline inflation, while highly visible gasoline prices are holding at relatively high levels versus recent history. These factors should be weighing on sentiment.
On balance, there are positives that could at least partially explain a rise in both the ISM and consumer confidence, but they don’t seem strong enough to justify the divergence with the official data. As such, are the surveys offering “fake news” or is it down to President Trump and his policies?
Trump the driver?
In terms of the key Trump factors going on right now, we have substantial tax cuts and fiscal spending increases, but we also have trade protectionism. However, not everyone reacts to these events in the same way. For example, we can see within consumer confidence that sentiment among the under- 35s has actually decreased since Trump was elected. For people aged 35-55 it has increased a decent amount while confidence among the over-55s has soared.
It could be that the under-35s tend to earn less so will benefit less from the tax cuts while they may feel more exposed to trade protectionism and potential trade wars that they feel could harm their long-term career prospects. An analogy could be Brexit in the UK with young people much more hostile and fearful of perceived economic nationalism.
Consumer confidence by age
Conversely, the 35-55s tend to earn more so will benefit disproportionally from tax cuts, which is likely to support sentiment. The over 55s, which may not benefit quite so much from tax cuts due to a significant proportion being retired (therefore earning less money), may have more nostalgia for the way things once were in America. Again, we use the analogy of Brexit where older voters disproportionally back leaving the EU.
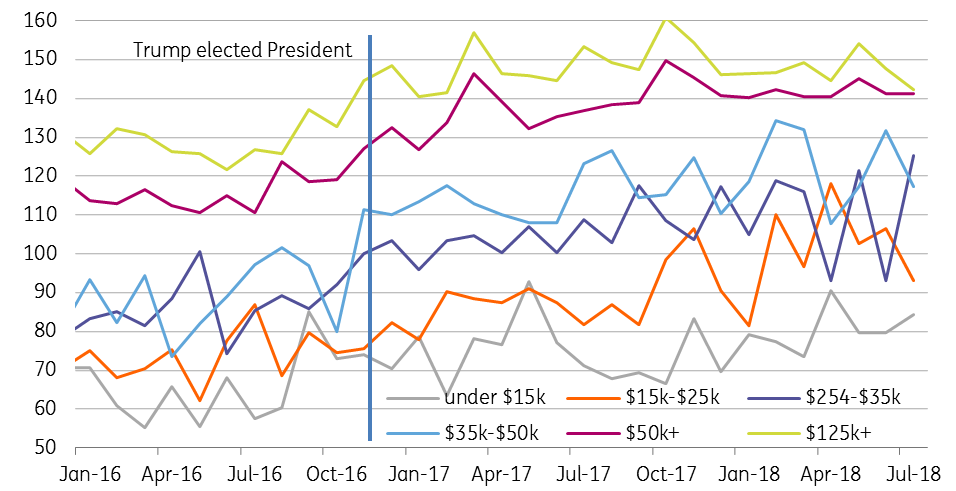
Consumer confidence divergences by income category are less easy to rationalise. Confidence amongst the highest earning groups has changed little since Trump was elected, but at least remained very strong. For the lowest earners, it has changed little from already low levels. In the middle-income categories, we see confidence has risen sharply for those earning $15k-25K and $35-50k, yet for those earning $25k-35k it has actually fallen.
Confidence by income group
Businesses are obviously very happy about the tax cuts, but are nervous about protectionism. However, conversations we have had with US corporate clients suggest the tax story is more impactful for them right now given the tariffs are measured in the tens of billions of dollars rather than trillions. This would likely explain the generally positive reaction in business surveys. Here we would point out that the ISM survey isn’t directly measurable on different categories and there is scope for human sentiment to influence the survey responses.
Why the breakdown?
It is important to point out that massive tax cuts while supporting business and consumer sentiment don’t necessarily translate directly into a massive increase in economic activity. For example, on the corporate side they may make firms more encouraged about the prospect for investment and hiring, but in actual fact, the money may instead be used on special dividends or share buybacks.
Likewise, for the household sector, the tax cuts are boosting real household disposable income and that is good news for household finances. But it is clear that households are not spending all of those gains, or certainly not as much as history would have suggested. Personal savings rates are rising so there does seem to have been a behavioural change in how consumers respond to income increases.
Ricardian equivalence… anyone?
Now, in terms of consumer spending, it could be that the US is suddenly behaving like a boring old rational academic economist. i.e. offering proof of Ricardian equivalence. For those that may have forgotten, the theory goes that forward-looking consumers and businesses feel that the huge tax cuts President Trump got through Congress mean government borrowing will rise sharply and unsustainably (we think the Federal deficit will hit 5% of GDP next year for reference). As a result, these households and businesses recognise that they'll be faced with substantially higher taxes in the future so are choosing to save the money to cover the cost of the future tax
Given the empirical evidence of Ricardian equivalence is somewhat tentative this would be a remarkable outcome. I don’t think this economist would behave that way, let alone the US population as a whole, but theories are there to be tested…
A behavioural context
The divergence between expectations and real consumer spending appears to align closely with Trump’s presidential election, an event that we expect will be influencing household sentiment. Behavioural science suggests that when faced with what feels like a sure loss, as some have described the most recent US voting environment, we have a higher tendency to gamble. In this case, the gamble has been Trump and relative uncertainty.
Steering away from predictability comes with risk and it can be challenging to maintain a consistent, or long-term trend in the face of ambiguity as we see comfort in altering our activities to play it safe in the short-run. Many of us are risk averse and the unknown impact and probability of change, such as a looming global trade war, is uncomfortable. This may be steering some towards reduced outlay as a 'just-in-case' measure.
And while market measures are currently relatively positive, we see strong employment, economic robustness and high asset prices, Trump’s low approval ratings suggest mixed feelings towards the confident and resilient president. Couple global scale impact and relative uncertainty and we may be starting to understand why consumer spending is lower than anticipated.
Will things revert?
There appears to have been a structural shift in the relationship between surveys and official data since President Trump was elected, but these “new paradigms” have a habit of fizzling out in the world of economics. It doesn’t necessarily mean that surveys are less useful in this new world, but it will perhaps make predicting the next downturn more challenging. If we get a drop in the ISM and consumer sentiment, is this really a downturn or is it merely a regrouping of surveys and data?
For now, we have to accept “great” official data and “fantastic” survey data. This isn’t a bad place to be and suggests the Federal Reserve will have to continue tightening monetary policy – at least twice more this year and two additional moves next year.
Content Disclaimer
This publication has been prepared by ING solely for information purposes irrespective of a particular user's means, financial situation or investment objectives. The information does not constitute investment recommendation, and nor is it investment, legal or tax advice or an offer or solicitation to purchase or sell any financial instrument.Read more

Included in the following bundle
In case you missed it: One hike, one tweak, one hold
- This bundle contains 7 Articles