Thailand’s trade slump may have troughed
- 24 July 2020
- Thailand
But there is no recovery in sight just yet. We see the recent Thai baht weakness persisting for the rest of the year as we revise our end-year USD/THB view to 32.30 from 31.50

| 23% |
June export fallYear-on-year |
| Worse than expected | |
A pronounced base effects
Thailand released its trade data for June showing a much weaker than expected trade growth.
Extending its worse year-on-year contraction since the 2009 global financial crisis, export posted a 23.2% YoY fall in June, following 22.5% fall in the previous month and steeper than the consensus of a 15.0% YoY fall. However, the negative print is mainly down to the base effect, while the monthly export level of $16.44 billion was marginally higher than $16.28 billion in May. As for imports, the base effect was rather favourable and together with a 9% month-on-month bounce it produced a much smaller year-on-year fall by 18.1% than 34.3% fall in May.
By-products, key export drivers – electronics and vehicles and parts posted strong month-on-month rebounds in June, although yearly growth rates stayed negative for both. Agriculture and jewellery were the weak spots with declines on monthly as well as yearly basis. On the imports side, it was an across-the-board improvement in fuels, capital goods, raw materials and consumer goods.
Trade slump may have troughed
Month-on-month recovery in both exports and imports is a hopeful sign of the current trade slump being close to its bottom, as what the Director-General of Commerce Ministry’s Trade Policy and Strategy Office, Pimchanok Vonkorpom, also thinks. But the recovery is nowhere in sight just yet given that worsening Covid-19 situation globally foreshadows a prolonged weak export demand ahead.
Adding to the length of recovery is drought across the country that’s hurting the agriculture production and exports. Earlier this week the Thai Rice Exporters Association cut its export target by 13% to 6.5 million tons, the lowest annual volume in two decades that could displace Thailand from its position as the world second-biggest rice exporter.
Still wide external surpluses
The trade surplus narrowed to $1.6 billion in June from $2.7 billion in May, bringing the surplus in the first half of 2020 to $10.7 billion, or $6.2 billion wider than a year ago. At this rate, we would see the annual trade surplus this year rising to about $16 billion from $9.6 billion in 2019.
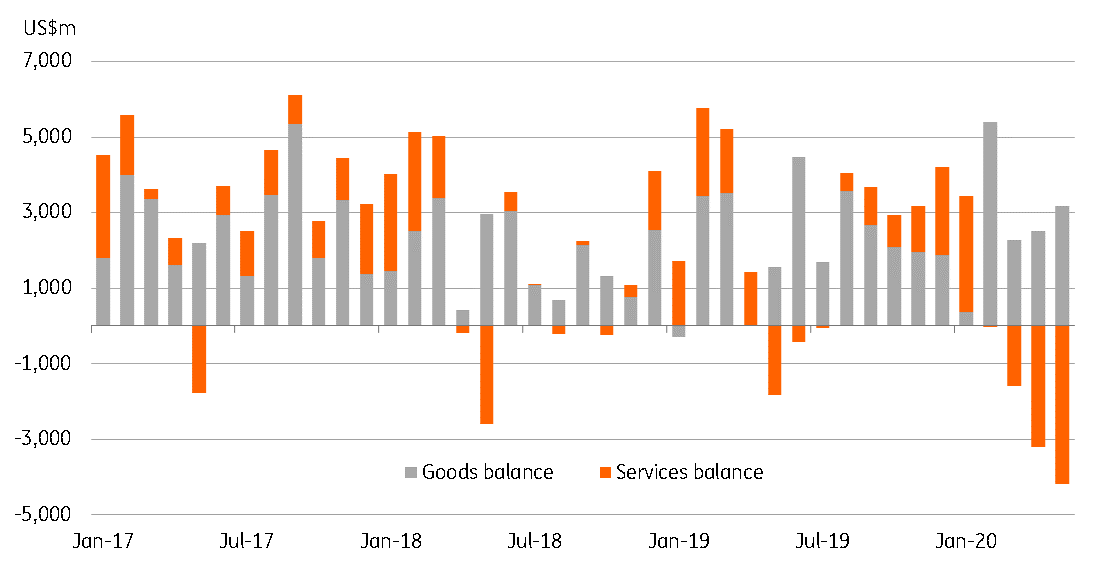
Even so, our forecast of a near-halving of the current surplus this year to about $20 billion remains on track. This is because net services outflow due to weak tourism offset wide merchandise trade surplus. Still, close to 4% of GDP, it will remain a relatively large current surplus among Asian peers.
What drives current account balance?
What does this mean for the Thai baht?
The persistently large external trade surpluses support currency appreciation. Authorities have been cranking up the volume of their rhetoric on the strong Thai baht hurting the recovery. They should be relieved to see the currency has shifted to be Asia’s weakest currency in July with 2.5% month-to-date depreciation after strong gains in May-June.
We revise our end-year USD/THB view higher to 32.30 from 31.50 (spot 31.77).
Content Disclaimer
This publication has been prepared by ING solely for information purposes irrespective of a particular user's means, financial situation or investment objectives. The information does not constitute investment recommendation, and nor is it investment, legal or tax advice or an offer or solicitation to purchase or sell any financial instrument.Read more