Sticky UK wage growth means no rate cuts for the Bank of England until 2024
UK wage growth is peaking and on its own, that doesn’t scream a need for the Bank of England to keep hiking much further. But the downtrend is likely to be gradual, and that suggests UK rate cuts will come later than in the US

Markets are pricing four more BoE rate hikes
A shock inflation reading last month sent Bank of England expectations soaring. Stubbornly high core inflation means traders now see another four rate hikes this year. Yet, CPI figures aren’t the only thing relevant to the BoE’s decisions, and the repeated focus from policymakers on measures of “inflation persistence” is a complicated way of saying they're looking at a broader range of data. That includes wage growth, and the news here has been slowly improving from the Bank's perspective. We’ll get fresh data on Tuesday.
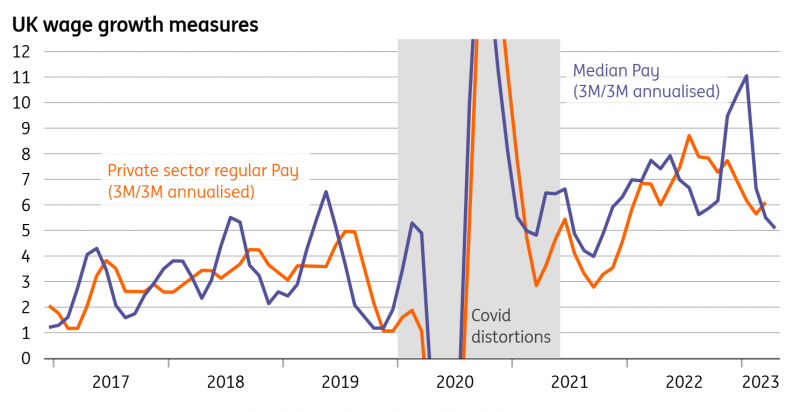
The data is admittedly volatile, and we expect to see the headline rates of wage growth – that compare the latest three months to the same period a year ago – to nudge higher this week. But that’s partly down to base effects, and if you instead compare the latest three months to the three months prior, wage growth tentatively seems to have peaked. That’s arguably a more useful measure of momentum in the pay figures, and is backed up by the Bank of England’s own survey of CFOs, which we know policymakers pay close attention to. This survey shows expected wage growth down to 5.2% from a peak of 6.3% at the end of last year.
Recent wage growth momentum has slowed
Inflation expectations have been driving wage growth, according to a BoE model
Assuming this trend continues, it doesn’t scream a need to take rates that much higher – or at least not as far as markets are pricing. But the more pertinent question is how quickly wage growth will fall back towards pre-Covid trends, and the answer holds the key to how soon the BoE might turn to rate cuts.
The BoE's model suggests that consumer inflation expectations are what have driven a sharp rise in wage growth over the last couple of years
The starting point is to understand what’s driven wage growth so high in the first place, and the Bank of England has often cited the results of a model based on a wage Philips curve and the work of former Fed Chair Janet Yellen. It assumes that wage growth is a function of inflation expectations, slack in the jobs market, as well as productivity growth. The BoE’s model suggests that it’s the first of those factors – consumer inflation expectations – that has driven the sharp rise in wage growth over the past couple of years.
Bank of England model of wage growth (recreated by ING)
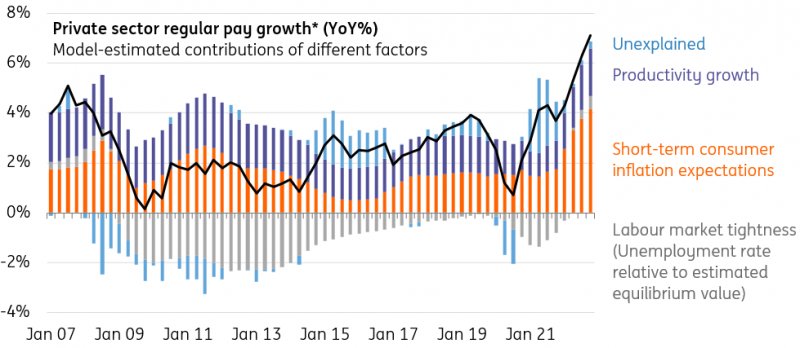
If that’s the case, then there’s a pretty strong argument that wage growth could fall back quite quickly. Consumer inflation expectations are often just a function of whatever petrol prices are at a given time (and perhaps currently gas and electric bills). Unsurprisingly, these measures have started to fall back, and that trend should continue as headline inflation drops materially over the coming months. We’ve recreated the Bank’s model, and we think in this scenario, you could see private sector wage growth fall a fair bit below 5% this year (from 7% now).
So, how realistic is that? There’s no doubt that higher inflation is a key factor here. It's the main determinant of the national living wage, which this year rose by almost 10%. It’s also driving higher public sector pay settlements, and the BoE points to a recent survey where high CPI was cited as the most important source of upward pressure on wage growth.
Then again, collective bargaining is not widespread in the UK jobs market. While it’s common for more than 90% of roles in some parts of mainland Europe to be linked to a collective bargaining agreement, in the UK it’s closer to a quarter – and the figure is much lower for the private sector.
In other words, beyond the minimum wage, the mechanism that translates higher inflation into sharper wage growth is less direct. It relies on workers becoming more willing to move roles to protect their disposable incomes, or for companies to pro-actively raise pay more aggressively to prevent that from happening. Ultimately, that all depends on the underlying strength of the jobs market.
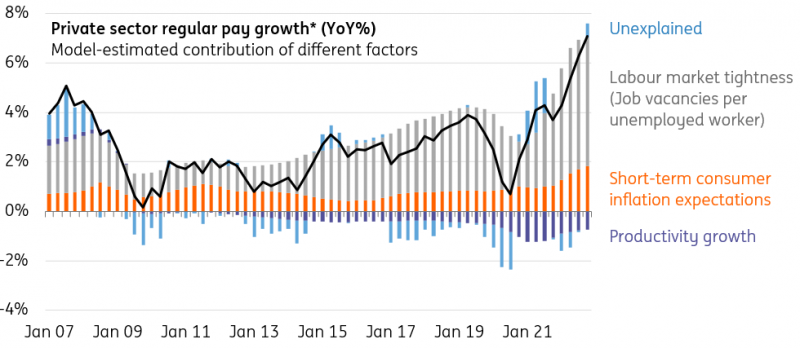
An alternative model suggests worker shortages have been a key wage driver
To make the point, we’ve tweaked the BoE’s model slightly. The Bank’s model appears to use the unemployment rate as a gauge of slack – most likely by comparing it to an estimate of the natural rate of unemployment or equilibrium value, which most guesstimates suggest is around 4%. The issue is that the unemployment rate fell only slightly below 2019 levels through 2022, despite other measures suggesting that worker shortages were considerably more acute.
We’ve therefore run the same model but with the ratio of unfilled job vacancies to unemployed workers as a gauge of slack. For the first time since the data began, there was more than one vacancy for every unemployed worker at the peak, and it's still well above pre-Covid levels.
The results, unsurprisingly, are pretty different from the model used by the BoE. As the chart below shows, this model suggests it was the underlying lack of staff that was the most important driver of wage growth through the pandemic, rather than inflation expectations.
Alternative model suggests worker shortages have been a key wage growth driver
Worker shortages have eased, but will remain a long-term issue
To be clear, we’re not suggesting that one model is better than the other – and in truth neither are particularly sophisticated and both have obvious flaws. But the point is that the worker shortages we’ve seen emerge through Covid are important for wages, and some of this increasingly looks like a structural issue that could be with us for several years.
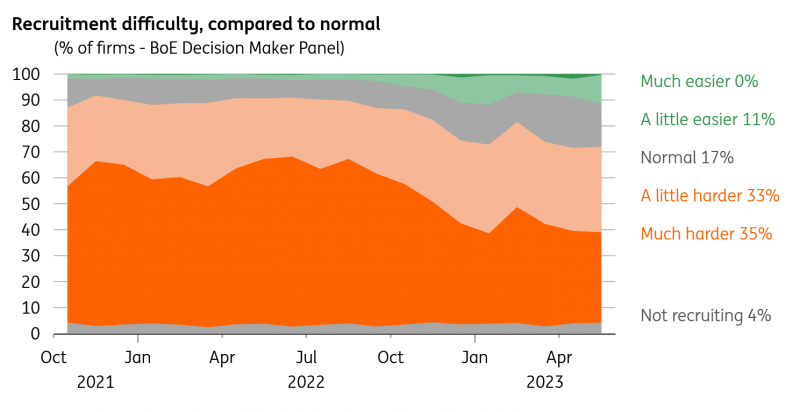
The good news is that worker shortages don’t appear to be as bad as they were last year. The Bank's CFO survey shows the percentage of firms finding it “much harder” to find staff is down to 35% from 65% last summer. That goes hand-in-hand with the fall in vacancies from the peak, as well as the slight improvement in worker participation we’ve seen recently and a rise in net migration.
However, the issue of worker retention is unlikely to go away completely. If nothing else, startling rates of worker sickness – borne out of issues in the health service – point to long-lasting hiring problems.
Under the revised model of wage growth where worker shortages are the key driver, the implication is that the fall in wage growth could be more gradual – and could perhaps end the year above 5%, which is some way above what's consistent with a 2% inflation target.
Worker shortages have eased since 2022
Bank of England impact
We still think we’re closer to the peak in interest rates than markets are assuming
For the Bank of England, we still think we’re closer to the peak in interest rates than markets are assuming. A 25bp rate hike in June could easily be the last – if not, in August – and it will depend on how many more CPI surprises we get through the summer. Either way, a slow downtrend in wage growth would suggest that rate cuts are unlikely to be a story for this year and are likely to come some time after the Federal Reserve begins easing. Our US base case is late 2023.
We’ve pencilled in the first cut for around this time next year, though eventually, we do expect a series of rate cuts that take Bank Rate down to the 3% area – some distance further than markets are currently pricing.
This publication has been prepared by ING solely for information purposes irrespective of a particular user's means, financial situation or investment objectives. The information does not constitute investment recommendation, and nor is it investment, legal or tax advice or an offer or solicitation to purchase or sell any financial instrument. Read more