Russia-China trade in national currencies: the product mix is key
- 18 October 2018
- Russia
The share of RUB and CNY in Russia-China trade has nearly quadrupled in the last 4 years but is still only 18-19%. Further growth towards 64-67% seen in Russia-CIS trade might be politically favoured, but also seems to be constrained by the RUS-CN product mix, which from the Russian side is fuel-heavy on the exports and machinery-heavy on the imports


Media sources indicate that Russia and China are drafting a pact on the national currency transactions. While the details of this document have yet to be disclosed, it is clear that it will be aimed at boosting the role of rouble and yuan in the Russia-China trade. The move appears to be in line with the political preference by both countries to reduce the role of the US dollar in the economy. We would like to put this initiative in an economic context, focusing primarily on the Russian side of the deal.
China's share in Russia's external trade is 15% and growing
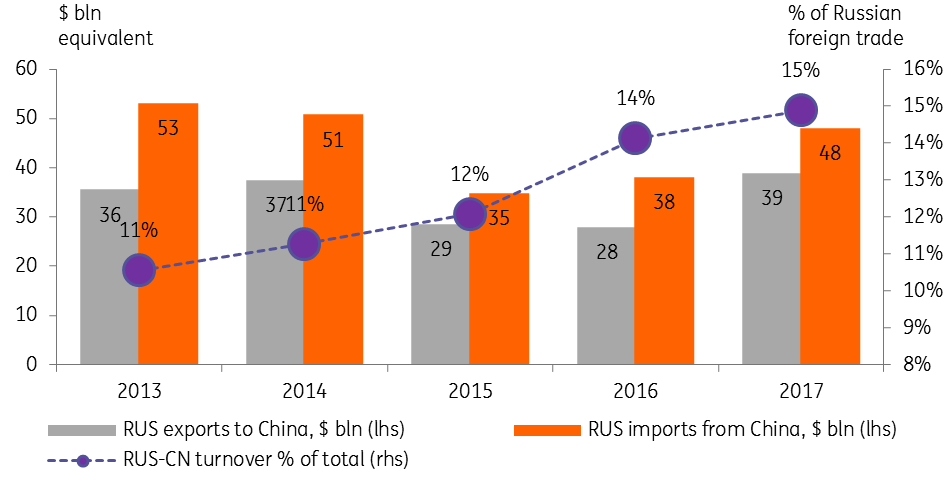
China has been steadily gaining its importance as Russia's trade partner over the last years. According to the Russian customs, the share of China in the Russian international trade turnover has increased from 11% in 2013 to 15% in 2017. On the Russian export side, this trend reflected mostly oil pipeline projects, which boosted China's role in Russian exports from 7% to 11%. On the imports side, following the 2014 tensions with the West, China replaced some of EU imports, which led to an increase of its share in Russia's total imports from 17% to 22%.
Notably, the USD value of the RUS-CN trade has not increased and remained around $80-90 bln - reflecting the effect of the ~50% oil price drop and the ~40% RUB depreciation seen over that period.
Russia-China trade in USD equivalent
CNY has rapidly gained 5% share in Bank of Russia's international reserves
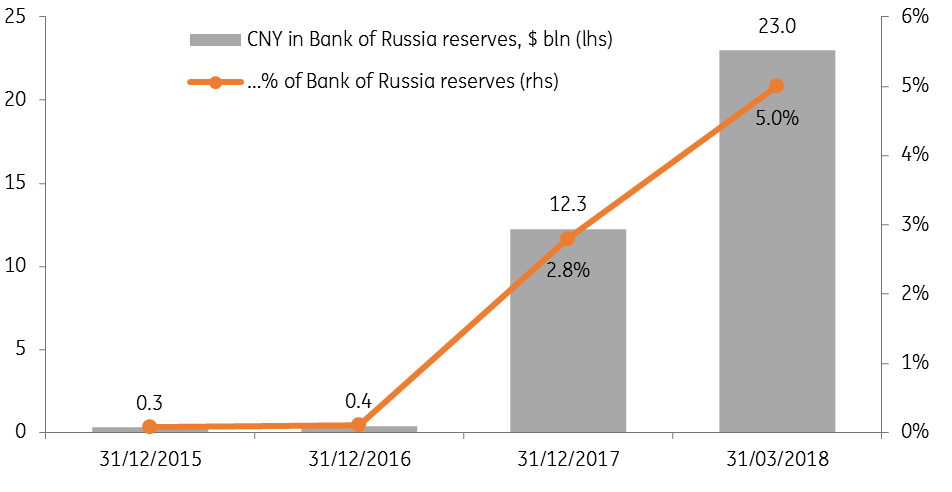
The growing importance of the Russia-China economic relations are mirrored in the growing share of yuan in the Bank of Russia international reserves. According to the regulator, CNY presence in the CBR reserves has ballooned from nil to 2.8% (US$12bn equivalent) as of year-end 2017 and nearly doubling to 5.0% (US$23bn equivalent) at the end of 1Q18. This took place amid the process of Russia's diversification away from the USD assets.
Role of CNY in the Bank of Russia international reserves
18-19% of the Russia-China trade is conducted in national currencies...
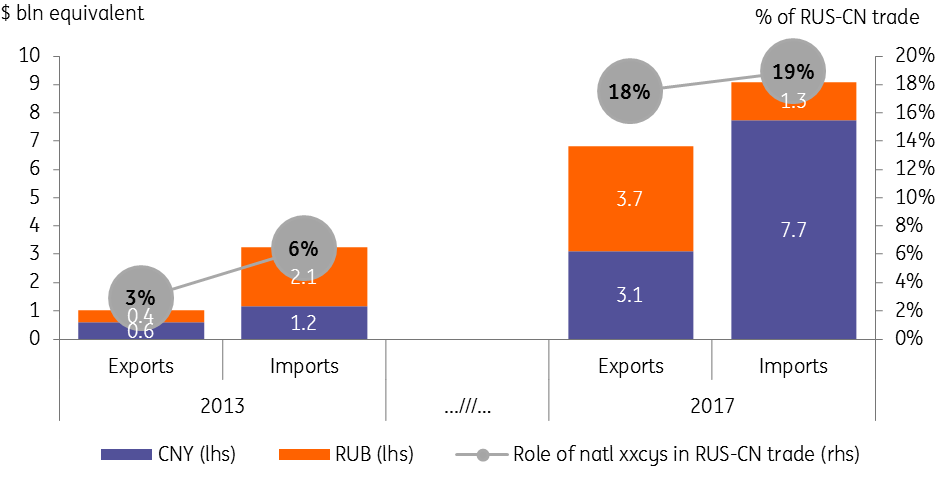
The role of national currencies in the Russia-China trade has also increased. Based on the data provided by the Bank of Russia and the Russian Customs, we estimate the share of RUB and non-USD&EUR (which we assume to be CNY) in Russia-China exports/imports has increased from 3%/6% in 2013 to 18%/19% in 2017. According to our estimates, up to US$11bn worth of Russia-China trade is conducted in CNY. We also do not exclude, that since the Russian external trade is reported in USD, the above-mentioned RUB depreciation might have put statistical pressure on the RUB share in external transactions.
RUS-CN trade in national currencies
...which is lower than 64-67% for Russia-CIS trade due to the differences in the product mix
Despite all the progress of late, the share of national currencies in the Russia-China trade is significantly below the 64/67% seen in Russia-CIS trade. We attribute this difference to the features of the product mix. As can be seen from the chart below, the structure of Russian exports and imports to China resembles that of Russia's trade with other non-CIS countries and is significantly different from the Russia-CIS trade.
- Russia's exports to CIS is over 50% non-commodity, including machinery and equipment, processed metals and other manufactured goods. Meanwhile, Russian exports to China is 65%, in line with exports to the entire non-CIS space. This leaves little for the products where pricing is available in the national currencies, explaining the small 10-18% share of non-USD&EUR transactions in Russian exports outside of CIS.
- Russia's imports from the CIS is by almost 80% comprised of the low value-added products from the agricultural and other raw material segments, and only 20% of complex manufactured products. The imports from China and non-CIS countries, in general, is a mirror image, as Russia uses those as a primary source of machinery and equipment. With China being heavily integrated into the global manufacturing chains, its potential for price setting in national currencies is so far unclear. The higher share of manufacturing in Russia's non-CIS imports corresponds to the 10-19% share of non-USD&EUR settlements in Russian imports from outside of CIS.
Russian foreign trade: product and xxcy mix
* non-CIS includes China

The key observation is that in the case of Russia-China trade relations the role of local currencies is somewhat higher than for Russia-non-CIS, but much lower than for Russia-CIS. This could be seen as an important indicator of the prospects for de-dollarization of Russia's international trade. The political will and the financial infrastructure indeed sets the stage for a higher role of national currencies in the bilateral trade, yet in order to achieve stronger results, more diversification of the product mix on both the export and import sides is needed.
Content Disclaimer
This publication has been prepared by ING solely for information purposes irrespective of a particular user's means, financial situation or investment objectives. The information does not constitute investment recommendation, and nor is it investment, legal or tax advice or an offer or solicitation to purchase or sell any financial instrument.Read more