Where a retail digital currency could thrive
- 13 December 2019
Where might a retail-digital currency thrive? We ask as Facebook's Libra was a wake-up call for central banks and global policymakers, and there'll be at least one or two contemplating launching such a currency of their own. We've examined global indicators to discover what might be coming next, and where

The concept of retail digital currencies is now being taken far more seriously, not least by us, for numerous reasons. They include financial inclusion and arguments about the public nature of money to efficiency and costs. And in this article we take a global perspective and ask ourselves where in the world could be most receptive to a digital currency infrastructure. We're only providing broad-brush, tentative answers using the World Bank's Global Financial Development Database. Crucially, a global perspective based on a limited set of composite indicators merely identifies countries where demand for more, better and cheaper financial services might be highest. That is not sufficient to establish a business case for launching a digital currency.
About the World Bank's Global Financial Development Database
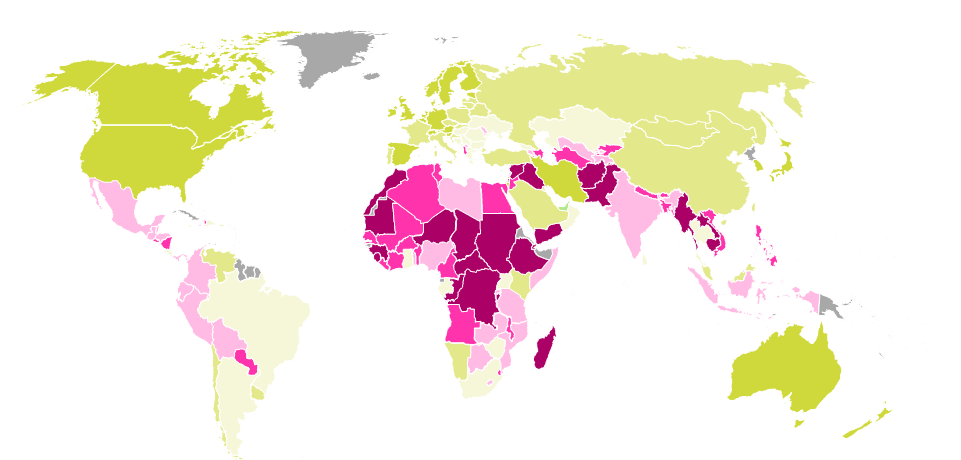
Financial inclusion 1: broaden access to digital money
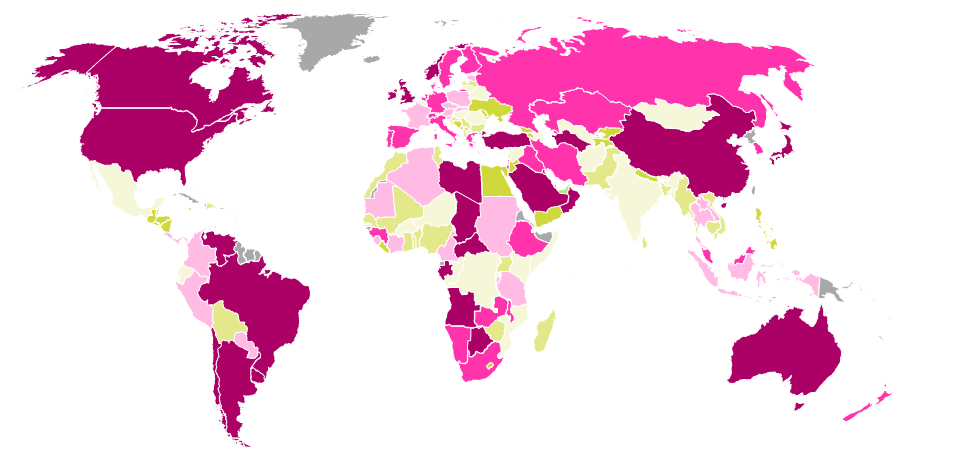
Introducing a digital currency, not reliant on existing systems but built as a standalone infrastructure which preferably extends across borders, makes the most sense in countries where access to, and usage of, existing digital means of payment is limited. The world map below shows access to digital money, measured as use of bank accounts, cards, electronic and mobile payments. Access is relatively broad in most developed economies, look at China (thanks to Alipay and WeChat Pay), Kenya (thanks to the mobile payment system M-Pesa) and most of South America. Africa and southern Asia stand out as areas where access to digital money could be broadened.
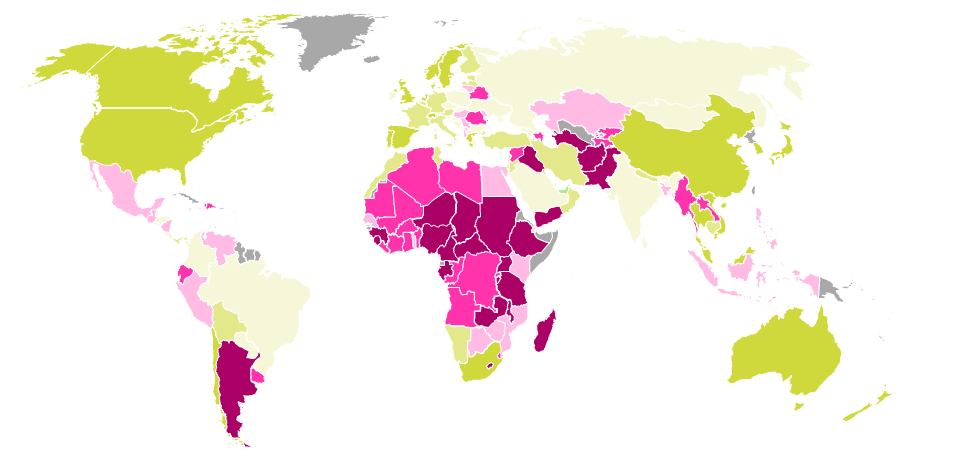
Financial inclusion 2: broaden access to credit
For businesses developing digital currencies, it may be attractive to offer (micro)credit as well. Platform companies have non-financial data on their consumers and suppliers, which they may use to assess creditworthiness fast and accurately. For less developed countries, improving access to credit may accelerate economic development. Most credit opportunities concentrate again on the African continent. In contrast, it is noteworthy that some countries in South-East Asia which score low on access to digital money, do offer relatively broad access to credit.
The BIS on the impact of bigtech on financial intermediation
Berg et al. on credit scoring using digital footprints
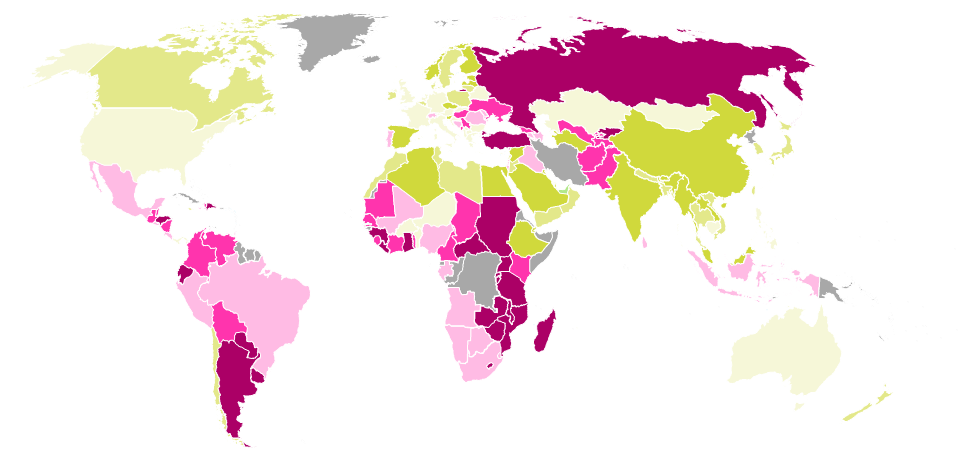
Efficiency and cost reduction
Scope for efficiency gains and business opportunities are bigger when the incumbent banking system is less efficient. The map below – though based on a small set of indicators whose significance should not be overestimated – shows that in most developed economies, the banking sector is relatively efficient. The Middle East and North Africa region also scores well, and thus lends itself less well to digital currency disruption from this perspective. Sub-Saharan Africa and Latin America show the weakest results.
The Boone indicator measures the degree of competition
Facilitating remittances
Sending money home across borders can be an expensive business, and an integrated infrastructure next to the current correspondent banking system could offer a new, cheaper and faster channel. The remittance market is growing at an astonishing rate: if we exclude China, remittances now outpace foreign direct investment (FDI) flows. Moreover, the global average cost of sending payments currently stands around 6.84% of the sum sent. To assess the importance of this to a domestic economy, we look at the inflow of remittances over GDP. The map below highlights in green the countries for which remittances are a relatively important source of income.
The World Bank's quarterly report on Remittance Prices Worldwide
So, what next, and where?
What can we conclude from our highly abstract analysis? The general picture that emerges is that there is most scope for improvement across Latin America, sub-Saharan Africa and parts of southern Asia, although for different reasons. In Africa, access to credit is most limited. In South America, efficiency and cost of finance offer opportunities. In southern Asia and Central America, a cross-border digital currency infrastructure might primarily be in demand to facilitate cheaper remittances.
Yet whether the introduction of a digital currency would be a successful or even sensible next step in the countries concerned, cannot be determined just by comparing a few global indicators. Relevant domestic circumstances are, for example, poverty levels, trust in and acceptance of intangible payment instruments among both merchants and the public, the presence and reliability of power and communications networks, and the applicable regulatory framework, to name just a few.
The introduction of a digital currency really requires a country-by-country approach
From a technical perspective, a digital currency infrastructure can only thrive if it is connected to and integrated into domestic and international systems, against manageable operating costs. This requires cross-border coordination and harmonisation by regulators, for instance, to agree on a digital identification method. Technical standardisation is also needed to avoid creating a new infrastructure which may develop into another difficult-to-maintain legacy a few decades down the road.
To conclude, while global analysis yields insights in the possible use cases for digital currencies across regions, the introduction of a digital currency really requires a country-by-country approach, taking into consideration local needs, circumstances and policies. Nonetheless, we note that demand for digital currency is more likely to rise in those places where the financial system is less developed and more fragmented.
The World Bank on the multiple aspects of financial inclusion
Content Disclaimer
This publication has been prepared by ING solely for information purposes irrespective of a particular user's means, financial situation or investment objectives. The information does not constitute investment recommendation, and nor is it investment, legal or tax advice or an offer or solicitation to purchase or sell any financial instrument.Read more