Quarterly to annual GDP growth: don’t be fooled by the technicalities
- 11 March
Eurozone growth is set to slow to 1.1% in 2026 from 1.4% in 2025, before an expected rebound to 1.6% in 2027, even as the quarterly pace is expected to improve towards the end of 2026. This mismatch is mechanical, driven by weaker carryover from late 2025 and calendar day effects


We trimmed our early 2026 quarterly growth path in light of Middle East tensions, but we still expect momentum to build quarter-by-quarter if the “ketchup‑bottle” effect of Germany’s investment plan kicks in. Annual averages of our forecast tell a different story though: they depend not just on within-year growth but on the level inherited from the previous year and on working day adjustments. With a smaller carryover into 2026 than into 2025, the annual rate declines strongly even as the underlying trajectory improves.
Carryover can make annual growth look slower despite a steady quarterly profile
GDP is a flow that adds up across the year. Even if two years look alike quarter-by-quarter, they can print different annual rates. What matters for the next year is where you finish: a stronger fourth quarter lifts the starting point, raising the following year’s average even when quarterly momentum is similar.
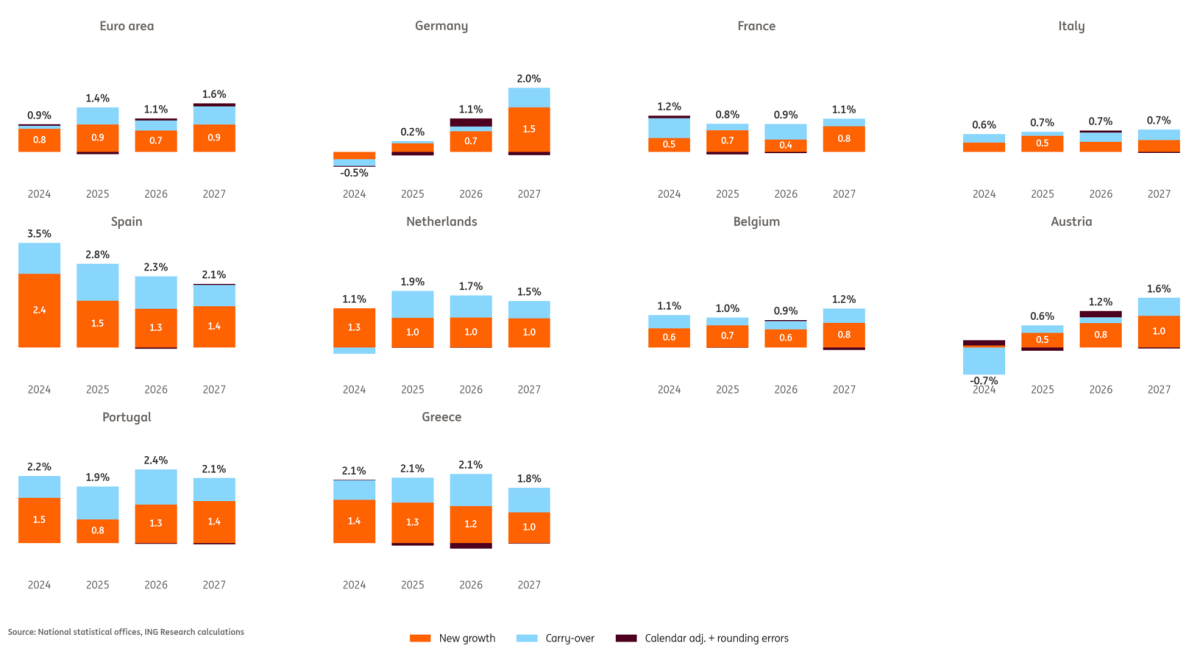
This helps explain our current outlook, acknowledging that forecasting GDP growth during the Middle East conflict is like shooting at a moving target: we expect 2026 annual growth to be weaker than 2025, even as quarterly momentum is expected to improve towards the end of 2026. This is because the carryover from the end of 2024 growth into 2025 (0.7 percentage points) is larger than from 2025 into 2026 (0.3 pp). Likewise, the rebound in 2027 builds mainly on the stronger carryover from late 2026 (0.6pp).
Decomposition of annual GDP growth forecasts
Working day adjustments can drive a wedge between quarterly and annual growth profiles
A second element to consider when translating quarterly GDP growth into annual figures is the difference in the number of working days between years. Based on national holidays – we do not account for regional holidays here – as the eurozone typically has around 253 working days per year. One additional, or less, working day compared to the year before can, in theory, therefore add or subtract roughly 1/253 times 100 is approximately 0.4 percentage points of value-added growth. Since a typical year deviates by about 1.3 working days from its long‑term average, this effect can be non‑negligible.
Reality is more nuanced, however. Several factors limit the impact of working day differences on annual growth:
- Some countries benchmark their seasonally and calendar adjusted (SCA) quarterly data to non‑seasonally adjusted (NSA) annual totals. In these cases, calendar adjustments effectively wash out when assessing annual growth. This appears to apply to Spain, Belgium, Italy, the Netherlands, and Portugal, meaning calendar day effects are irrelevant for interpreting their annual GDP growth rates.
- In countries where working day differences do matter, the actual impact tends to be smaller than the theoretical maximum. This is partly because extra working days sometimes fall during periods of low economic activity, such as around Christmas, reducing their effective contribution to output, and are sometimes offset by additional vacation days. Moreover, in industries with continuous or near continuous production, the impact of an additional working day can be smaller than its theoretical maximum, according to the ECB.
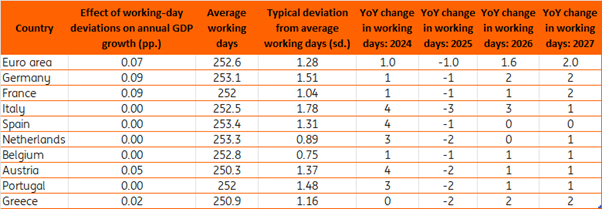
An estimate based on historical data from 2000 to 2024 shows that Germany and France exhibit the strongest sensitivity: each additional working day compared to the previous year raises annual growth by roughly 0.1 percentage point. This finding is consistent with estimates from the German statistical office and the French statistical office. Austria and Greece also display calendar effects, though markedly smaller. At the eurozone level, where the SCA series is derived indirectly as a weighted aggregation of national data, the impact is estimated to be around 0.07 percentage points per working day, although the estimate is somewhat noisier.
Estimated impact of working day deviations on annual GDP
What working day patterns mean for euro area growth through 2027
Looking ahead, these calendar effects will influence annual growth figures in the euro area in the coming years. In 2025, annual growth was slightly dampened because the euro area had, on average, one working day less than the year before. Both in 2026 and 2027, annual growth can be expected to be around 0.1 percentage points higher thanks to the addition of almost two extra working days. This effect is largely driven by Germany, which registers two extra working days in 2026 (adding regional holidays, this can run up to 2.5 additional working days) and an additional two national working days in 2027, potentially lifting its NSA annual growth rate by up to 0.18 percentage points per year relative to its SCA growth profile.
Against the backdrop of an expected cyclical upturn in Germany, it will thus be important to distinguish between the mechanical impact of working day adjustments on annual growth and the structural improvement coming from increased investment in the years ahead.
Content Disclaimer
This publication has been prepared by ING solely for information purposes irrespective of a particular user's means, financial situation or investment objectives. The information does not constitute investment recommendation, and nor is it investment, legal or tax advice or an offer or solicitation to purchase or sell any financial instrument.Read more