President Trump’s tariffs: Did the ‘forgotten men’ get their jobs back?
Industries, like steel and aluminium, that President Trump protected with higher import tariffs have shown above-average jobs growth and the downward trend in overall manufacturing employment has stopped. However, this isn't the result of the promised 'industrial revolution' but reflects lower productivity growth that may not last
A new industrial revolution
“I will be the greatest jobs president God ever created”, Donald Trump said when he announced he would run for president back in 2015. In the same speech, he promised a new industrial revolution that would restore manufacturing and bring back jobs that had disappeared to China and other emerging economies.
During his election campaign, President Trump laid out his trade policy which can be characterised as America’s trade partners should grant the US better terms of trade or else face higher import tariffs at US borders.
2018 showed that President Trump wasn’t bluffing. The president picked a fight with China and many other countries by hiking US import tariffs on a wide range of products. While tariffs are primarily a means to pressure trade partners into giving the US better trade terms, President Trump doesn't really hide the fact that he likes tariffs too. “I'm a tariff man”, he tweeted last December. He thinks import tariffs are good for economic growth and employment.
We're not trying to answer the question about the overall effect of Trump's tariff policy on US employment but instead, we're focusing on manufacturing employment to see whether President Trump has managed to address the needs of the ‘forgotten men and women’ in manufacturing that lost their jobs
Have the tariffs created new jobs in the targeted industries and what has been the effect in other manufacturing industries where steel and the other targeted products are used as inputs?
For a complete analysis of the effects of tariffs on employment, we should also look into the impact on employment due to retaliatory measures by US trade partners and take into account second-round effects on consumer spending and business investments. For example, employment effects due to Chinese tariff hikes on American soya beans, are ignored in this article. But it’s worth noting, that these kinds of retaliatory measures amount to about USD140 billion, less than half of the USD300 billion of US imports that have been impacted by the hikes.
So, we're not trying to answer the question about the overall effect of President Trump's tariff policy on US employment. Instead, we're focusing on manufacturing employment to see if he has managed to address the needs of the ‘forgotten men’ in manufacturing that lost their jobs.
Since most tariff hikes were implemented in the second half of 2018, there isn't enough data available for a conclusive analysis. Nevertheless, it's possible to draw some tentative conclusions for a few industries, as they've been subject to elevated tariffs for somewhat longer, resulting in six to nine months of available data.
We also try to get an idea of the impact of tariff hikes on the performance of manufacturing as a whole. In that way, we take into account that tariff hikes raise input costs for many manufacturers which potentially undo positive employment effects in the industries protected by higher tariffs.
President Trump's tariff hikes in 2018
- February 2018: President Trump hiked tariffs on the import of solar panels and washing machines in an attempt to halt the dominance of Asian producers.
- March 2018: President Trump picked a fight with a wide range of countries by elevating tariffs on steel and aluminium by 25 and 10 percentage points.
- July 2018: President Trump started a bilateral trade battle with China by imposing 25 percentage point tariff hike for a package of USD 34 billion of goods imported from China followed by the same tariff increase on a package of USD 16 billion in August.
- September 2018: After Chinese retaliation, President Trump stepped up the fight with a 10 percentage point increase in tariffs on no less than USD 200 billion of imports from China.
The steel and aluminium test
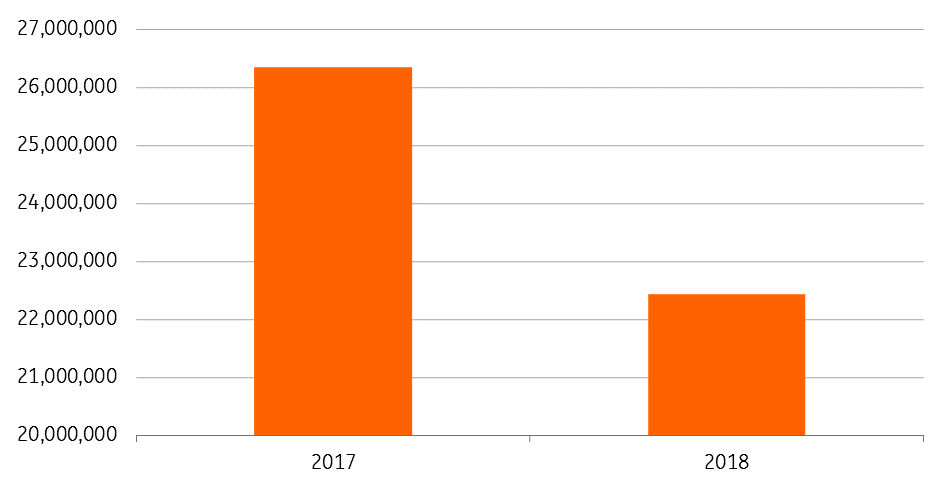
Higher tariffs on steel seem to have been successful in diminishing the American use of foreign steel. Imports of steel volumes have been 12% lower in the nine months after the increase in tariffs than during the same period in 2017, as you can see below.
At the same time, the growth of steel production in the US accelerated from 4% in 2017 to 6.2% in 2018 - above the growth of worldwide steel production (4.8%). However, the growth of US steel exports was lower. In other words, US demand for steel has been serviced to a large extent by domestic steel producers than in the past and this increase in the use of domestic steel, at the expense of foreign steel, is precisely the goal of President Trump's protectionist policies.
Demand dropped back at the beginning of 2019, but this may be tied to uncertainty after temporary concerns about the government shutdown at the start of 2019 and fear of a US downturn in late 2018, signalled by sharp sell-off in risk assets. We suspect a rebound.
US steel imports (metric/tons)
April- December
Steel and aluminium output
(monthly in tons)

Now, how has this influenced employment in the steel (and iron) industry? Well, jobs growth was 2.4% in the six months after the tariff hikes. The figure below shows that’s 1.5 times higher than jobs growth during the same period in 2017, and also higher than employment growth in total manufacturing for the whole of 2018 (2.1%).
Employment growth before and after the tariff hike
Employment growth in steel, iron and aluminium industries for the first six months after the tariff hike compared to the same period in the previous year

The turnaround in aluminium production has been even better than in steel after several poor years: a 33% increase in production since the imposition of aluminium tariffs (chart 2). The evidence regarding job creation is positive as well: a 3.2% job increase in the first six months after the tariff hikes, compared to a decline of 0.3% in the same period a year earlier, according to the Bureau for Labour Statistics.
Negative price effects
To get a grip on the overall impact of President Trump's steel and aluminium tariffs on manufacturing employment, effects on other industries need to be taken into account too. In the US, steel is an input for many industries and the tariff hikes mean those industries suffer from higher steel prices.
Price increases for different types of steel in the six months after tariff hikes
Annual increases through September 2018 for PPI steel series
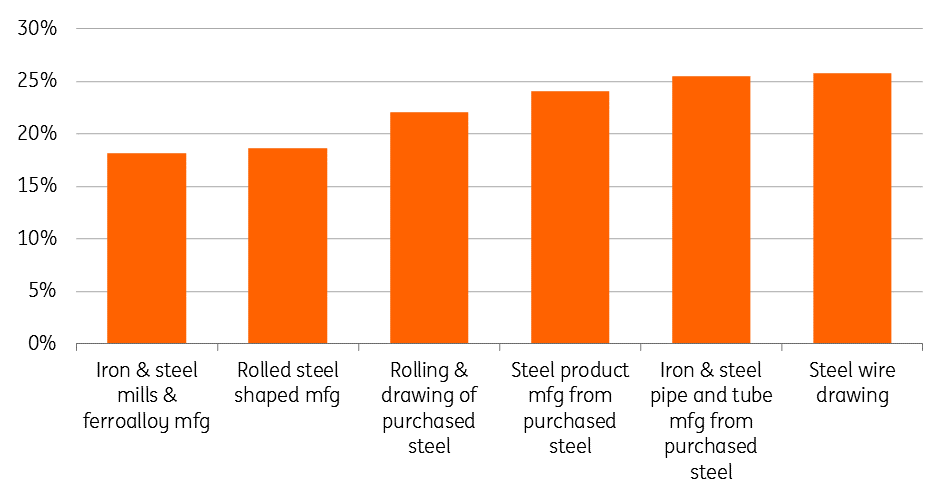
Higher input prices will either lead to higher product prices, which suppresses demand or leads to lower profit margins that could result in lower business investments. So, it’s not surprising that many steel-using companies have objected to the tariff hikes and warned about negative employment effects. For example, Ford Motor Co. is blaming President Trump’s tariffs for an increase of USD 1 billion annual increase in costs.
Other companies like Caterpillar Inc and 3M Co objected to the steel tariff hike too and said tariff-related costs for this year would likely be USD100 million or more.
Limited damage
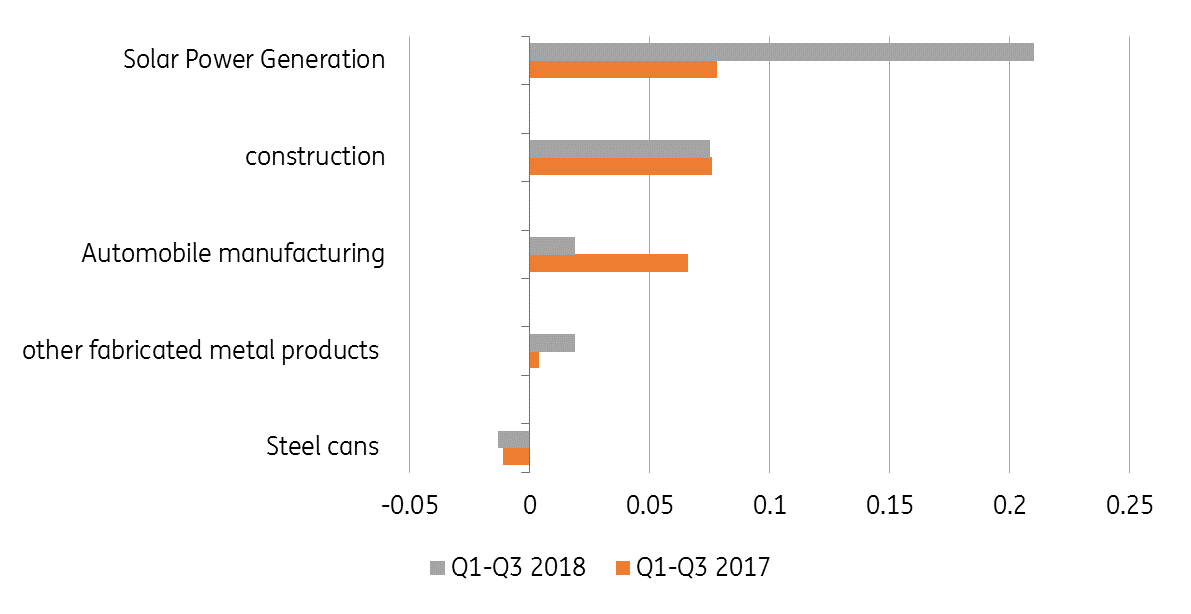
The negative indirect effects of higher steel prices have probably contributed to somewhat slower development of production and employment in some manufacturing industries, as the chart below shows. However, so far it hasn’t led to eye-catching setbacks.
US automobile industry is a good example. Employment growth was 1.9% during the six months after the tariff hikes. That is less than half the job growth during the same period in 2017, but better than total manufacturing employment growth. Apparently, the cost- effect of the tariffs and potential fall out of demand through higher prices isn't strong enough (yet) to undo tailwinds like the corporate tax reform of late 2017.
Not high production, but low productivity in manufacturing is key in explaining jobs growth
US car companies complaints about steel tariffs have so far not led to their undoing, but haven’t completely fallen on deaf ears either. Automakers are probably taking solace in the prospect of potential tariffs on car imports now that the Department for Commerce has, according to press agency AFP, decreed that the import of cars is a threat to the US and a national security issue. President Trump has until mid-May to decide whether to proceed and if he does hike tariffs, it would make American autos more competitive from a pricing perspective.
The industry for steel cans is another industry that has been hit by higher costs of steel. In this industry, employment contracted by 1.3% in the six months after the tariff hike. Bad news, but not much worse than the employment development in the same period in 2017 (-1.1%) before the tariff hikes on steel and aluminium.
At first sight, construction is a sector that seems little affected by the higher costs for steel and aluminium, although it's important to remember that, especially lumber, costs are more important cost factors for residential construction. Interest rates are also low, so that has helped support demand. Nevertheless, we observe that the higher prices of steel and aluminium haven’t spoiled the employment party that started in 2017, at least not yet. Employment increased by 7.5% in the six months after the tariff hike, almost the same growth as in the same period in 2017 (7.6%).
Another industry that uses steel as an input is the so-called ‘other fabricated metal products’, where the evidence isn’t very worrying either. Employment is up more than 5,200 (1.9%) between the start of 2Q and the end of 3Q which is five times as much as during the same period in 2017, and more than the average jobs growth in US manufacturing during this period (1.4%).
Employment growth (%), selected industries
Washing machines
Unfortunately, data on domestic production and employment in the washing machines and solar panels industry is insufficient to draw conclusions about the employment effects of the tariff hikes in these industries. But we do have some information that allows us to get an idea of the potential negative side effects.
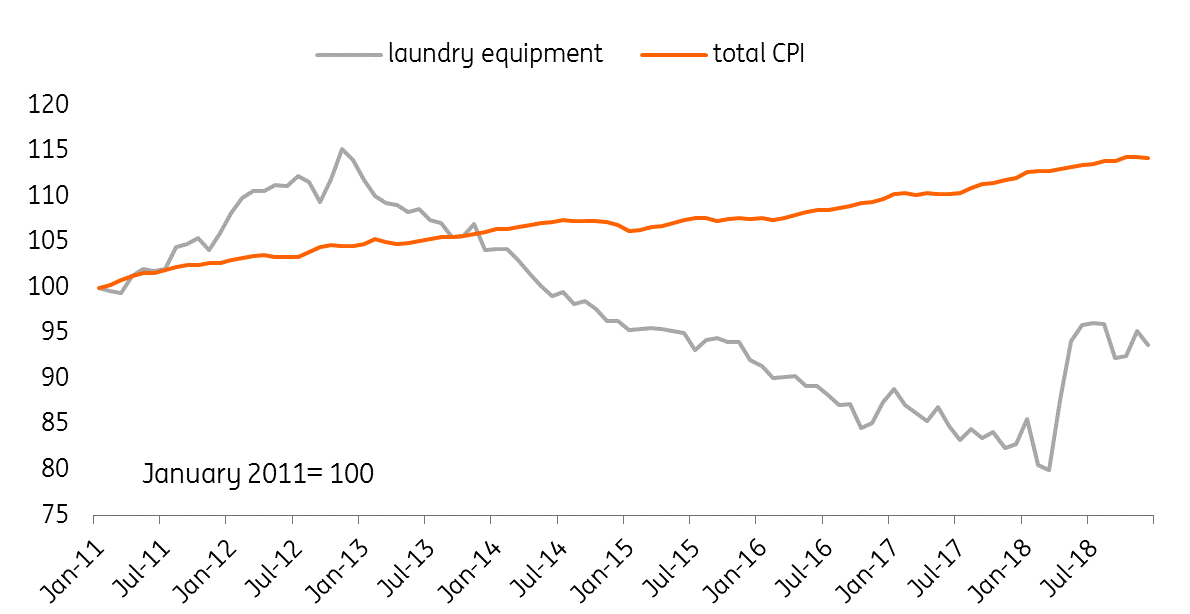
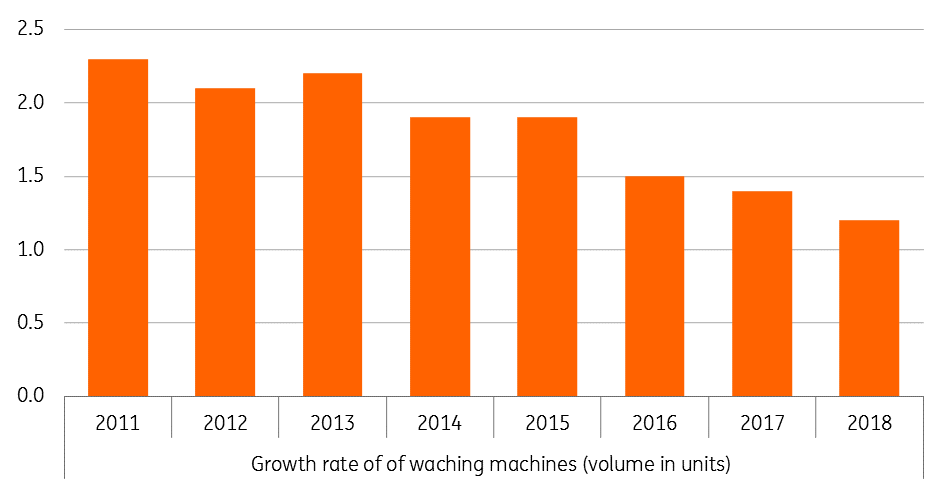
The chart below shows tariff hikes have fired up US consumer prices for washing machines. The negative effect on demand for washing machines seems bearable though because more washing machines were sold in the US in 2018 than in previous years (chart 7). The growth of sales was lower than in 2017, but only by a small amount. And, this decline seems to be only partly attributable to the price rise, because the slowdown of the growth rate fits in a long-standing downward trend.
Because of the lack of data, we don’t know whether the tariff hike has succeeded in replacing imported washing machines by domestically manufactured machines and subsequently raising employment in the US. Having said that, anecdotal evidence points to some positive employment developments. Sales growth at LG, one of the largest suppliers of washing machines, has been accompanied by employment gains when it opened up a new factory in Tennessee this year. We also see that some companies expanded existing facilities, such as Samsung’s plant in South Carolina.
Higher prices for washing machines in the US
Washing machines sold (units, growth rate per annum)
Solar panels
No disaggregated employment data is available for the solar cells/ panels sector either. However, the (employment) development in the solar power generation sector can indicate whether the price increase of solar panels has restrained growth of this sector. After all, 90% of the 38,000 people working in the solar business are employed in the installation business which could be hurt by lower demand caused by the price rises of the panels due to the tariff hike.
The negative effect of higher prices on demand for this product seems to be limited as well. Growth of production of solar power has been three times as high in the nine months after the tariff hike in January than in the same period in 2017.
Summing up
Looking at the data for the industries we've looked at suggests the direct effect of the tariff hikes has been positive in steel and aluminium industries. The indirect effects on production and employment in other sectors, through higher prices, seem to wipe out these benefits in some cases, like for steel cans. For industries like the car industry and construction, the rise of input costs (steel and aluminium in this case) hasn't prevented the growth of production and employment, although at a slower pace than in 2017 in case of the car industry.
For washing machines and solar panels, indications are that tariffs haven't done harm either, although it should be stressed that data availability for washing machines and solar panels is poor.
A turnaround in total manufacturing
After steel and aluminium, a wide range of Chinese products that have been targeted by the US administration with tariff hikes in 2H18. They are mainly for manufacturing industries in the US. Data about employment development after the tariff hikes in many cases isn't available yet. However, given the fact that it concerns hikes for thousands of input products, looking at the performance of production and employment in total, manufacturing gives us some idea if the positive direct effects (on production and employment in the targeted industries) are wiped out by losses in industries that use these products as inputs.
A first glance, total manufacturing employment suggests President Trump has brought about a positive turnaround as promised. Manufacturing employment has been growing since he took office in 2017 and last year’s 2.1% increase (264,000 jobs) is the best jobs result since 1994, as you can see below.
Annual change in manufacturing employment

What about Rust Belt states?
Interestingly, the so-called Rust Belt states which saw significant declines in their manufacturing sectors in the 1980s have continued to underperform. Iowa, Illinois, Pennsylvania, Wisconsin, Ohio and Indiana have all seen weaker employment growth than the growth for the entire economy as the chart below shows.
As such, it doesn’t appear that President Trump’s policies have yet been able to produce the industrial revolution that he promised the ‘forgotten men’ in this region, although the growth of employment is, of course, better than decline which was the case during most years since the ’80s.
Employment growth (%) at state level since the start of 2018

Anyways, the president can point to the fact that under his watch total manufacturing jobs, as a proportion of total US employment has been growing. That is a reversal of the steep downward trend since World War II. The pace of job creation in manufacturing outpaced that of total US employment in each of the first two years of his presidency, as you can see below.
The president can point to the fact that under his watch the share of manufacturing jobs in total US employment has been growing
Manufacturing has begun to underperform once again since late 2018, but we will need to wait and see if this is the beginning of a renewed downward trend of the share of manufacturing employment in total employment. It could also just be a temporary blip. There has been a noted improvement in the ISM manufacturing index and its employment sub-component in March. Anyways, the net increase of manufacturing’s share in total employment during Trump's watch suggests that besides general policy measures like the tax cuts, that have impacted employment in all sectors of the economy, something else is going on in manufacturing.
As we've shown above, in some cases the tariff hikes have stimulated employment in the sectors involved with apparently limited damage through the indirect effect of higher prices. But this non- random selection of a couple of sectors doesn’t say much about the development of total manufacturing.
Maybe something else is responsible for the positive employment performance of manufacturing under the Trump presidency. Actually, aggregate data for manufacturing shows that seems to be the case indeed.
Manufacturing employment (%) of total employment

Not high production but low productivity is key
The figure below shows that the 2.2% average production growth of manufacturing during 2017 and 2018 is very good compared to the previous two years but is nothing special if we look a bit further back in time. During the period 2005- 2016 (with the exceptional crisis years 2008 and 2009 taken out), average production growth of manufacturing production has been 2.2% as well.
Annual percentage production growth, manufacturing and all economy
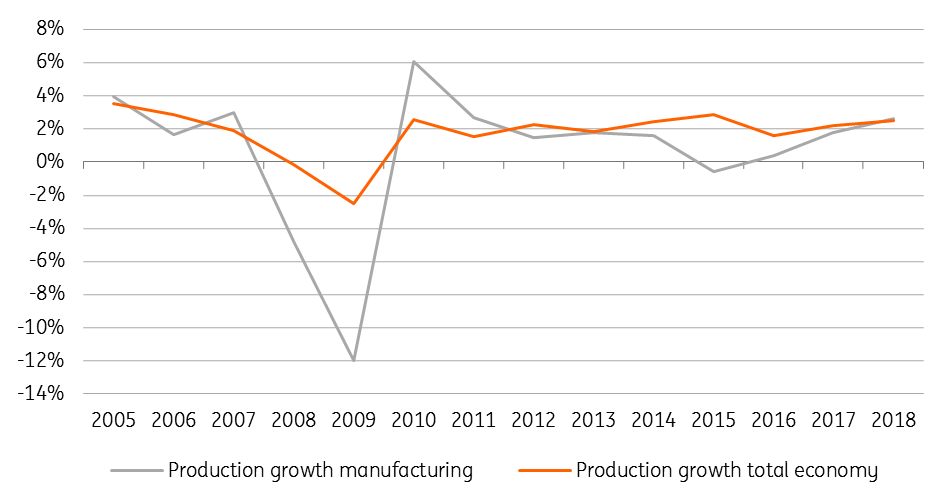
Secondly, the chart also shows that manufacturing hasn’t done better than the overall economy. The overall economy grew a bit faster over the last two years (at an average rate of 2.4%).
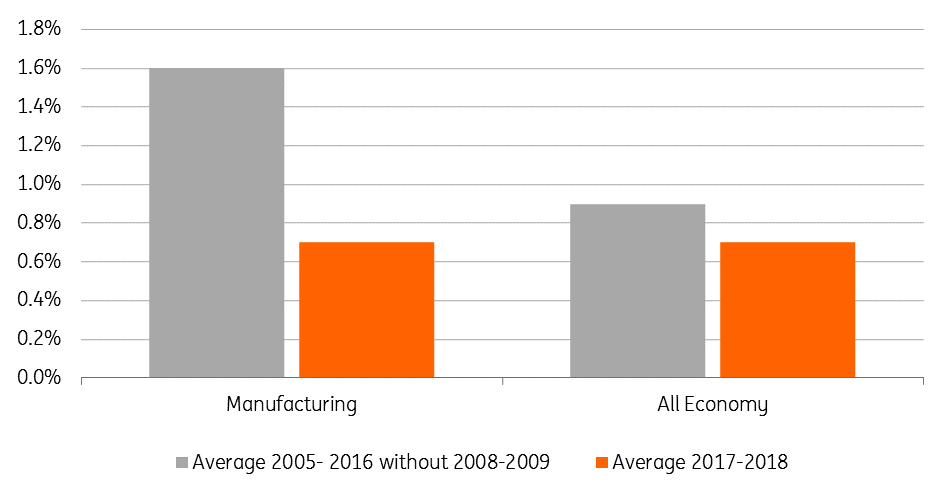
So, how come that the share of manufacturing jobs in total employment has gone up? The answer is weak productivity growth in manufacturing! Labour productivity grew on average at 0.7% in 2017 and 2018, compared to an average of 1.6% during the 2006-2016 period - again excluding the crisis years of 2008 and 2009.
If productivity had developed at this previous pace, less extra labour would have been needed to produce the production growth that has been realised in 2017 and 2018. In this case, employment growth in manufacturing would have been only 0.9%. considerably lower than the average of 1.6% during the preceding ten years (excluding the crisis years).
A look at the productivity growth for the entire economy shows that jobs growth has been stimulated in other sectors as well by the slow productivity growth over the last two years, but not as much as in manufacturing (Figure 12)!
Large productivity drop in US manufacturing under President Trump’s watch
Unintended side effects
One potential reason for the weak productivity is that US companies simply over predicted demand for their products and hired too many workers. This would tie in with the decline in manufacturing out of total employment in recent months. Businesses may now be slowing their hiring of manufacturing workers after the recent softer patch for US growth.
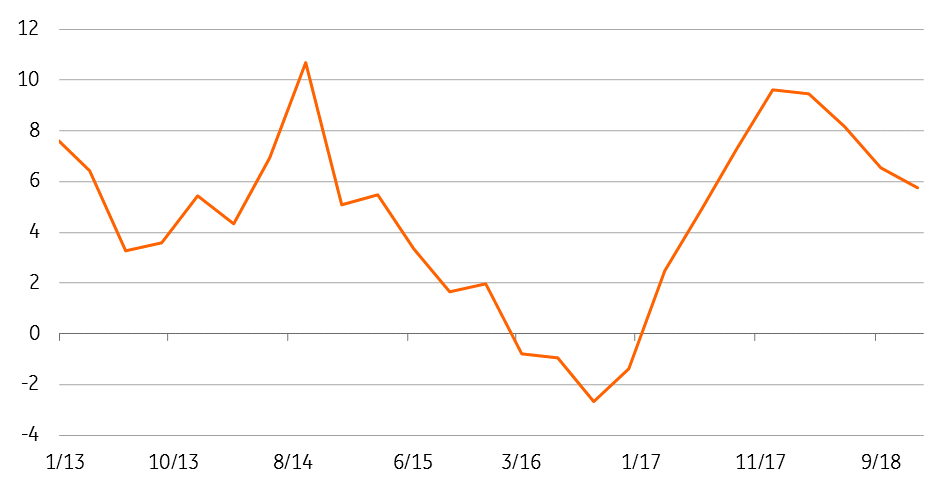
The strong hiring, weak productivity nexus for manufacturing could also be because of the uncertainty that President Trump’s trade policy has created. Businesses might be reluctant to make significant financial outlays on capital expenditure, given fears that an escalating trade war will push up costs, hurt supply chains and limit access to foreign markets in the future. Therefore, to boost output in the near term, firms have been using more labour rather than long term investments in capital goods like machines and production facilities. This aligns well with the observed slowdown of capital expenditure on equipment for the second half of 2018. (Chart 13).
Lower productivity growth was probably not President Trump's goal of the trade war, but as far as uncertainty about trade has contributed to lower productivity growth, the President will welcome this unintended effect of his controversial trade policies.
If the US can strike trade deals with China and the EU in 2019, this may give businesses enough clarity and confidence to make more capital expenditure investments. The result could be that worker productivity growth rises and production growth in manufacturing leads to fewer employment gains than in recent years.
Annual capital expenditure on equipment in manufacturing
What does this mean for the 2020 US presidential race?
If people have jobs and rising pay, President Trump will be keen to take credit for all of this, as he seeks re-election next year. We can see that of the 11 states that have shown the fastest employment growth since the beginning of 2018 than the national 1.9% increase, nine were won by Donald Trump in the 2016 presidential election. They accounted for 123 of the 538 college votes used to determine who wins the presidency. So if he can retain these nine states, he is close to halfway to achieving the 270 electoral votes he already needs. The caveat here is that migration and demographic change will have an impact on the results too.
Also, the top states for employment growth taken by Democrat Hillary Clinton in 2016, Colorado and Nevada were viewed as key swing states that could have gone either way, accounting for a further 15 college votes. Convincing electorates in these important swing states that his tariff and tax policy is responsible for their strong employment performance will be critical in his election campaign.
Conclusion
US manufacturing growth has increased since President Trump kicked off his trade war, but we have to remember the economy was already in good shape and received further boost from a pick-up in real incomes and his 2017 tax reform.
Manufacturing production growth has been higher too, but it doesn’t beat growth in the rest of the economy and isn't significantly higher than the average of the previous ten years. So, for now, we can't really see anything, which we might call the ‘new industrial revolution’ that President Trump promised.
US manufacturing growth has increased since President Trump kicked off his trade war. However it is not higher than the average of the preceding ten years, so we can't really see the ‘new industrial revolution’ as the president promised. Employment growth however has been above average, but this mainly reflects lower productivity growth.
For jobs growth, it's a different story. There are clear signs of positive direct effects of the tariff hikes, given the above-average jobs growth seen in the steel and aluminium industry. There is no disaggregated employment data for solar panels and washing machines, but indicative data, like units of washing machines sold, don’t look very bad either. Moreover, the mentioned counterweights to the price pressures have limited the negative employment effects of the cost increases. But the jobs growth is largely due to weaker productivity growth.
The indirect effect on other manufacturing industries with higher input prices has been, by definition, negative. But sound profitability of US manufacturers means this cost rise hasn't always translated (fully) into higher prices. As far as price increases are concerned, they've probably been bearable for now given the rise in real household incomes.
We'd like to repeat the fact that our analysis is a partial one and doesn't take into account the employment effects of retaliating trade partners implemented after the US hiked tariffs. Neither does it evaluate the employment effects outside manufacturing.
Despite the fact that manufacturing employment growth can largely be attributed to falling productivity growth, President Trump's good jobs track record gives him the opportunity - politically - to say that his trade policies have been helpful and if anything, are likely to serve him well in the 2020 presidential campaign.
Concerning his particular interest in the ‘forgotten men’ from the Rust Belt states, the President can point to manufacturing employment growth there too but it is lower than in other states.
This publication has been prepared by ING solely for information purposes irrespective of a particular user's means, financial situation or investment objectives. The information does not constitute investment recommendation, and nor is it investment, legal or tax advice or an offer or solicitation to purchase or sell any financial instrument. Read more
Download
Download article
24 April 2019
What’s happening in Australia and around the world? This bundle contains 9 Articles

