Mid-year gold outlook: Timing the dollar
- 25 July 2018
- Commodities daily
The US dollar rally has knocked gold into a substantially lower trading range with funds shorting the market in record numbers. Those shorts stand a good chance of being covered in 3Q but we ultimately pin a recovery in gold prices on whether the dollar reverses in 4Q


Taming the greenback
Gold has traded foremost as a currency through 2018, feeling the pressure from the dollar rally and in relative ignorance of the alternative drivers including geopolitical tensions, equity volatility and even yields. Charting the 60-day correlation visibly demonstrates that gold has had its longest and deepest negative inverse relationship with the US dollar index since 2005. Meanwhile, correlations with yields and equities have let up considerably since the tail end of 2017. Recently, gold has shown some signs that it could free itself from this deep relationship, with the 60-day correlation almost halving from nearly 80% to 40%. We think that's just a blip though and expect the dollar to drive gold through 4Q, at least.
If gold remains deeply connected to moves in the dollar as per our base FX forecast, gold prices ought to now be finding a floor and start improving into the next quarter.
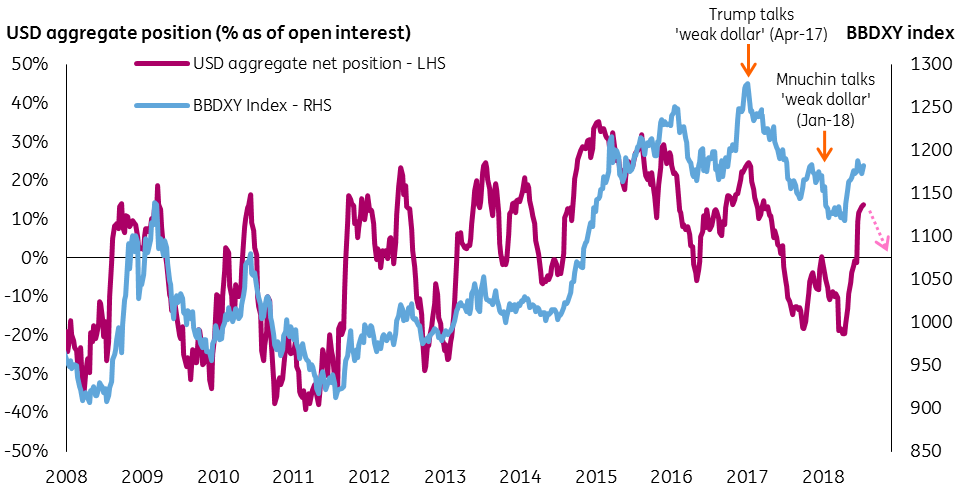
President Trump's criticism of China and the EU for manipulating their exchange rates and the Federal Reserve for hiking interest rates is expected to stem the dollar rally. The rhetoric reflects the administration’s desire for a weaker dollar and we expect flows into the greenback to settle down. But our FX strategists think we’re unlikely to see those fresh longs bail out until Trump's hard-line on trade dissipates. ING economists think that will happen sometime in the fourth quarter after the November mid-term elections.
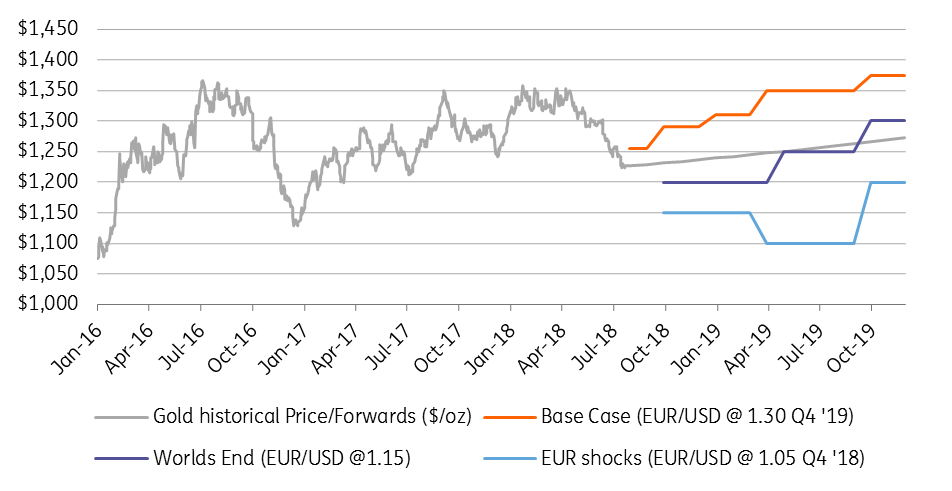
The relative EU-US outlook, meanwhile, is expected to narrow on the back of political stability in Italy and Germany amongst other factors. Our currency base case (EUR/USD at 1.23 by year end) then sees gold edging back closer to the $1300’s and we forecast an average of $1290/oz for 4Q.
Gold's inverse dollar correlation has stood above all others- will it weaken?

Dollar rally shifted to long allocation post the short covering. Can Trump talk drive an exodus?
A range of scenarios
Clearly though, there is a fair degree of downside risk which warrants an analysis of the alternative scenarios. According to our FX team, a “World's End’’ (all-out trade war) scenario could result in a 1.15 average 4Q rate for the EUR/USD (over 50% of the dollar trade-weighted basket), as trade wars prompt a flight to safety (flows into the dollar) though gains would be capped by a more dovish Fed whilst the ECB could also extend quantitative easing.
Reflecting the support from monetary policy, gold would likely hold up better than the currency trend would dictate, just above $1200. Traditionally, gold would then start to benefit from the assumed flight to safety through 2019 but it's been a poor competitor to US assets in recent months. Given gold's identity crisis, we assume a milder recovery.
In the “Negative EU shocks” scenario, the US gets off scot-free without any retaliation after attacking EU car imports. The escalation of political issues in Italy and Germany sees EU growth and equity prospects underperform a seemingly trade-immune US. And the euro drops to 1.05. The risk then becomes skewed for the Fed to hike rates more aggressively and gold would likely fall below $1150/oz for the first time since its brief dip in December 2016. As the euro starts to recover against the dollar towards the end of 2019, gold should return to $1200/oz.
Of course, this analysis all hinges on our expectation that the strong gold-dollar relationship remains intact, which is contrary to the more recent trend. We think the weakening correlation was a blip after the much shorter-term (10-day) correlations briefly turned negative in the second half of June.
Short-term correlations have since bounced back. Gold has been dropping further than the dollar in the last two months but only to make up the gaps in May when gold managed to stay flat through the dollar's gain. In the absence of the monetary reactions listed above, we would think there would be little reason for gold to move independently in the short term. The Fed is expected to stick with a “gradual” tightening policy of one hike per quarter. In 2019, we do expect gold to outperform currency trends as the yellow metal wins back investor confidence and structural issues with the US economy return to the fore. (For background read ING's July economic update).
Gold outlook swings on EUR/USD scenario:
Limited physical support on weak consuming currencies
We previously suggested that as gold prices went below $1300/oz, some support could come from increased physical buying. Unfortunately for gold bulls, those physical buffers haven't materialised. Indian gold imports were down 38% in the first half of the year. A GFMS survey shows that imports are expected to end the year down 28% year on year. Imports could increase in the second half because of more auspicious days (lucky for Indian weddings) and bumper farmer profits but the depreciation of the rupee is making buying gold a costly business for the second largest consumer.
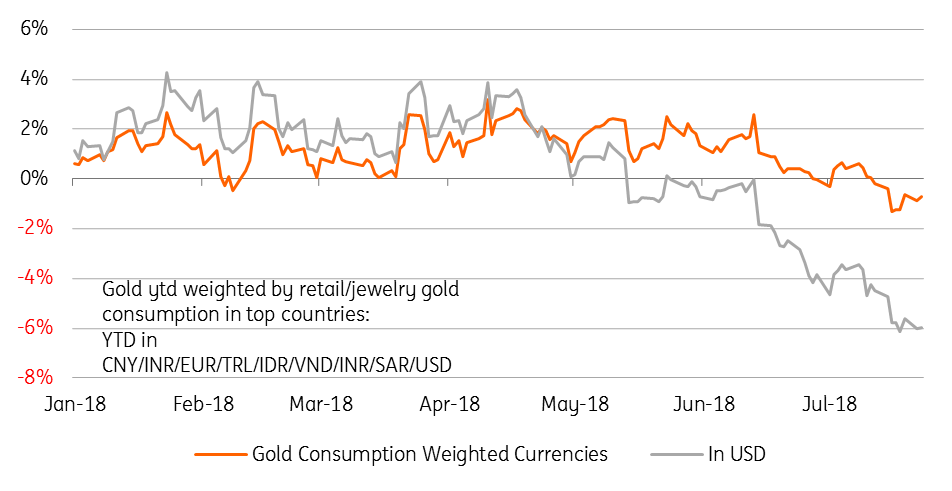
This is a general trend; the weakness of emerging market currencies hits at the purchasing power of gold's largest consumers. We have done a weighted-price comparison for the currencies of gold's largest retail and jewellery consumers in India, Turkey and China, where local currencies have seen some devaluation. This shows that the gold “consumption price” is down less than 1% year-to-date compared to the near 6% drop in US dollar prices. In other words, for all of gold’s poor performance, it doesn’t look like a bargain to most of the physical market.
Gold consuming currencies dont see any bargains
Gold in USD vs. gold in currencies weighted by jewelry and retail gold consumption
A short-covering bounce for 3Q amid buyers drought
For 3Q, we forecast gold to average $1250, which requires the spot price to trade at an average of $1255 through August and September. This is a decent 2% increase and perhaps a tall ask without much direction from the dollar, which is forecast to stall but not decline until 4Q. Our view is largely based on the extreme amount of short positioning.
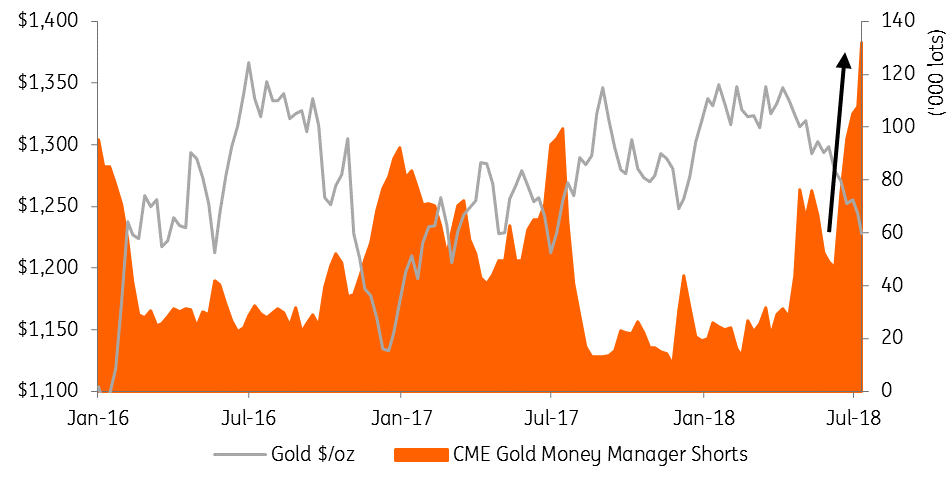
Having gone from uninvolved in gold, funds have now built the largest amount of short positions on record. The short gold vs the dollar trade is in such abundance that we see a good chance for profit taking, as Trump talk halts the US dollar. Profits quickly turn into covering, with some additional buying support likely as core CPI looks set to surpass the psychological 3% mark.
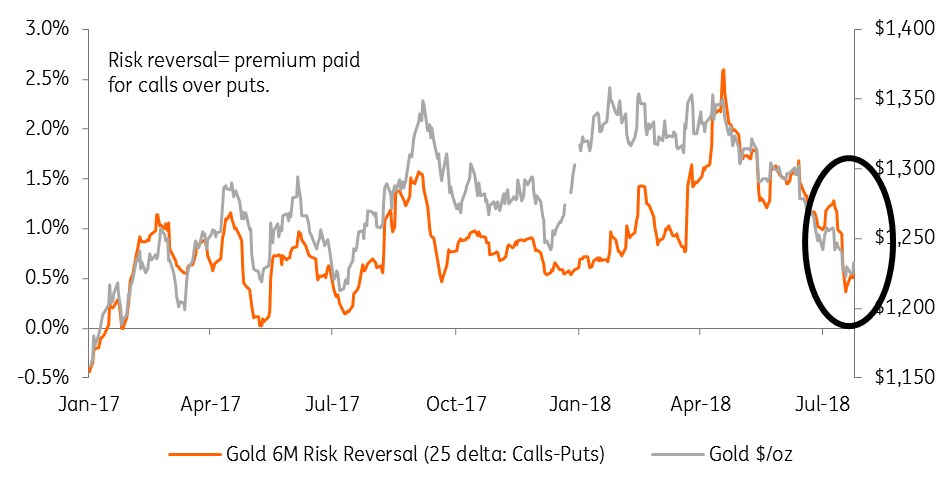
We are under no allusions that fund flows, until now on the short side, have shunned gold as an asset class. For this reason, our short covering bounce expected this quarter seems unlikely to translate into a sustained rally. Gold’s range-bound performance in 1Q (until eventually falling) frustrated the fund universe having been a poor attractor of safe-haven inflows through equity turmoil or geopolitical tensions. Hopes that funds might still hold a positive, albeit unallocated, bias have now also evaporated since the options skew to calls has reversed. The stickier ETF crowd has now also joined the exodus, with ETF gold holdings sliding 3% (2.2Moz) since May. Regaining investor trust will be essential if gold is to substantially break out of its rout.
Short gold positions have surged to record highs. They could cover in weeks to come
The last sign of the bulls also drops: Gold's positive option skew back to lows
Longer term bulls: $1400/oz in 2020
Whilst adjusting the pace, we have stuck to our original bullish thesis that gold will trend towards $1400/oz, although now our expectations have been pushed back to 2020 from late 2019. If the EUR/USD does drop to 1.35, as our team forecasts, that could well be enough to achieve those levels in 2019. But we think it's likely the currency correlations begin to weaken as gold’s gains attract a wave of profit taking: physically and on paper.
Our forecasts for a sustained rise in gold prices will then likely need more than just currency moves. Gold will need to re-attract and hold investor flows. We spoke earlier about gold’s emerging identity crisis in 2018, failing to make gains through geopolitical events, equity corrections and even swings in yields. Investor frustration and the exodus of longs left gold vulnerable to the dollar this year. Winning positive flows back will begin to follow, we expect, after those initial dollar-driven returns. Thereafter, we expect structural issues with the US economy to return to the fore: funding the twin deficits and the political backdrop etc. This all plays into our structurally bearish view on the dollar. But gold’s safe haven qualities should then see additional benefits in an environment of stubbornly higher inflation and a “gradual” tightening from the Fed.
Content Disclaimer
This publication has been prepared by ING solely for information purposes irrespective of a particular user's means, financial situation or investment objectives. The information does not constitute investment recommendation, and nor is it investment, legal or tax advice or an offer or solicitation to purchase or sell any financial instrument.Read more
Included in the following bundle
In case you missed it: From ‘foe’ to friend?
- This bundle contains 6 Articles