Metals hit in the trade-war crossfire
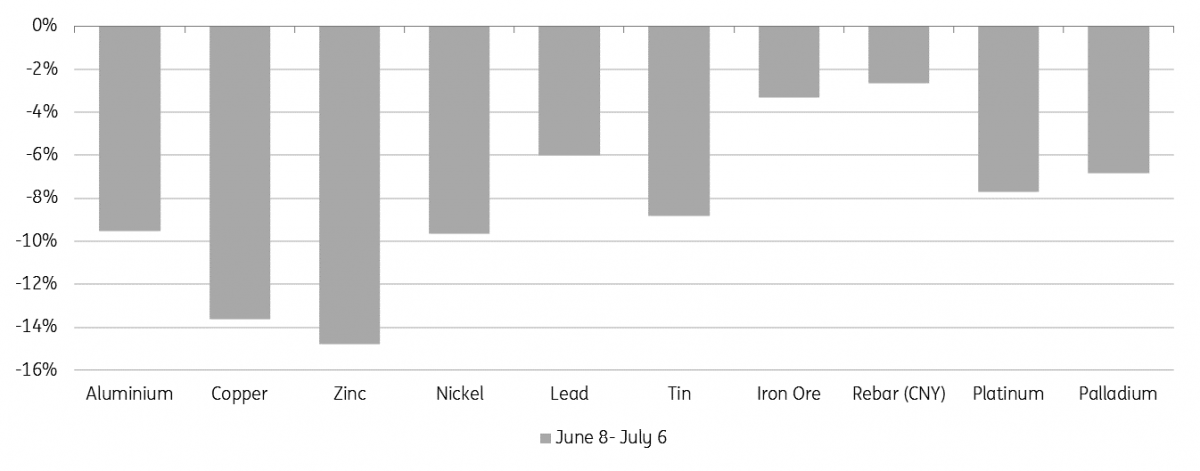
The Industrial Metals index has lost 13% since last month's G7 summit to the run-up to today’s US-China trade tariffs. If it all rolls over this could present a substantial buying opportunity for some. In the worst case scenario, the more construction-weighted metals should hold up best
Long Metals? Look away now, it's been bleak

Copper falls well below incentive pricing
As trade tensions escalate, copper, the most macro of the metals has been hit hard. It is down 14% or $1000 since the G7 summit. We suspect the first $500 drop should be seen as the reversal of an undue rally above $7300 led by a technical tightness in the spreads (read: copper back to a back). But nonetheless, it's evidently macro concerns from escalating trade wars, and perceived risks to demand, which have gone on to send prices to their lowest since taking a leg up in September 2017.
When Copper first broke into the $6,500-7,500 trading range it was most likely excessive speculation on SHFE that drove the move. But the red metal held its ground and prices were rationalised by the need for higher prices to incentivise new mine supply so as to avoid looming post-2020 deficits. We see that mine incentive price level at around $6,800/mt, so a sustained dip is only still consistent with that fundamental narrative if the demand hit is so extreme as to avoid those future shortages.
Closing copper's supply gap by 2023 requires over a 500kt demand loss which, on a top-down basis, needs a cumulative 2% hit to current world GDP. That goes well above our economists' scenarios for any direct effects of trade tariffs (more on that later) unless it were to escalate into a full-blown trade war, where the US indiscriminately lays down 20%+ tariffs, for instance. Unquantifiable knock-on effects to business and consumer sentiment could potentially cause such a hit, but our economists still look to the trade rhetoric calming post the November mid-term elections and the potential for a deal to be formed.
By 2025, copper's supply gap, even including current probable projects on a low demand scenario (1.6% CAGR), gets closer to 1Mt. In short, even if President Trump does keep playing hard ball, the case for copper at $7k is likely to resurface. How long that takes depends on the extent demand growth gets derailed in the meantime.
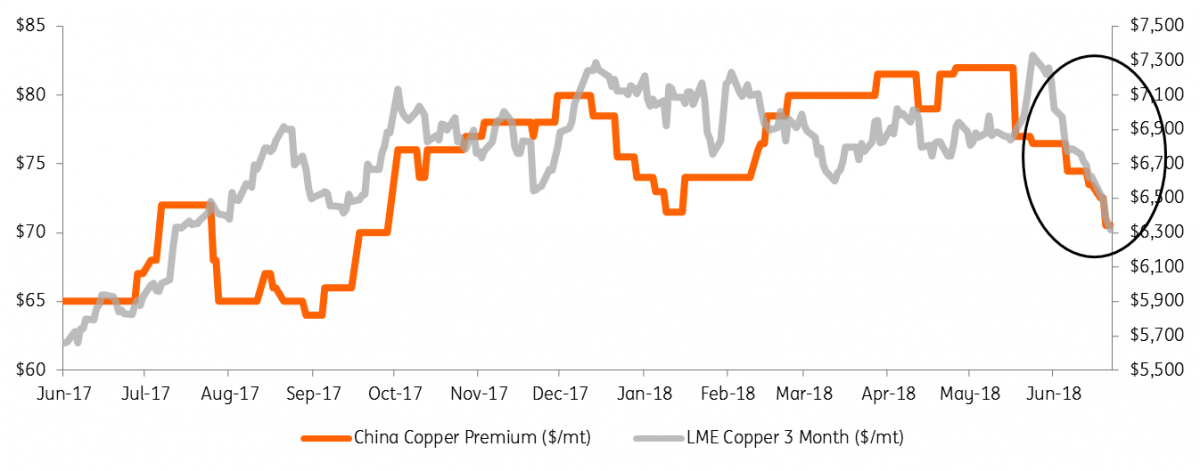
Staying with copper, it’s important to flag the sentiment isn’t confined to just the paper markets. Chinese premiums also tumbled through June (-14%). A few moving parts are at play including tighter spreads on the LME (which curb financing), but given strong imports (+16% ytd against a closed arbitrage, Shanghai in contango and the weak premium), the flows into China seem more pushed than pulled. We are concerned whether the current environment is hindering the appetite of downstream industry and traders to accumulate stocks.
The good news for copper is that it has such a fundamental narrative to stemming the sell-off whereas zinc has been left to fall more freely. There's a broad consensus that metal is nearing the end of its bull run (as mine supply rebounds in H2) and so prices are down an even harder 15%; funds and consumers are less convinced to buy the dips.
Not just paper, Chinese copper premium also drops

The direct trade-GDP risks are low for metals demand
At least as far as direct impacts on trade flows are concerned, our trade economist sees only minor risks to global GDP. Today’s tariff’s (July 6th) to $50Bn along with a China retaliation is only expected to impact 0.03% global growth (cumulatively over 24 months) which looks minimal on our copper GDP-demand sensitivity (<10kt).
Scale up to one of Trump's threats (scenario 2) and the direct hit is -0.17% or 40kt and still not enough to cancel out our original forecast deficit in 2019 (-60kt).
It’s our all-out global trade war scenario that carries real downside for demand, costing 185kt of demand through to the end of 2019, putting the market into a reasonable size surplus (+100kt) which could weigh further on prices.
Even on our pre-trade war base-case though it is important to flag the nearby refined copper supply-demand balances, which are looking fairly uninspiring (2018,2019 = -30,-60kt deficits). Physical indicators may not be sufficient to provide much direction even if the trade war dialogue resolves. As we note above, only a real trade war or substantial knock-on effects to business/consumer confidence can really swing the balance into a decent size surplus that would necessitate further downward moves in prices. Sentiment is likely to rule for the next few months at least.
Copper trade-war demand scenarios
Thinking about demand exposure
Metals' demand from manufacturing (white goods, autos etc) is the most exposed to export demand and the most directly at risk of a global trade war. Construction may well be affected through the knock on to wider sentiment but it should be lagged. We are not surprised to see Iron ore and Steel have overall held up better, bearing this potential insulation in mind and that Chinese housing starts have been so strong year to date.
While we see good upside potential for China to take active measures to stem the risks to growth, it is Chinese GDP that is most at risk for all scenarios short of a US vs. The World trade war. This bodes well for Aluminium on a relative basis where we feel China's export tax for primary metal allows Chinese and LME markets to move with a degree of independence (it's not all about China). If the risks do go on to get more skewed to ex-China or to the auto markets, it could get more painful for aluminium, however. Looking more vulnerable, copper’s global and diversified demand base across manufacturing/consumer goods has already been heavily targeted and the Platinum-group-metals have also proved weak, those being the most vulnerable to auto sales which sit at the heart of Trump's quarrel with the EU.
Metals' demand exposure
Download
Download article"THINK Outside" is a collection of specially commissioned content from third-party sources, such as economic think-tanks and academic institutions, that ING deems reliable and from non-research departments within ING. ING Bank N.V. ("ING") uses these sources to expand the range of opinions you can find on the THINK website. Some of these sources are not the property of or managed by ING, and therefore ING cannot always guarantee the correctness, completeness, actuality and quality of such sources, nor the availability at any given time of the data and information provided, and ING cannot accept any liability in this respect, insofar as this is permissible pursuant to the applicable laws and regulations.
This publication does not necessarily reflect the ING house view. This publication has been prepared solely for information purposes without regard to any particular user's investment objectives, financial situation, or means. The information in the publication is not an investment recommendation and it is not investment, legal or tax advice or an offer or solicitation to purchase or sell any financial instrument. Reasonable care has been taken to ensure that this publication is not untrue or misleading when published, but ING does not represent that it is accurate or complete. ING does not accept any liability for any direct, indirect or consequential loss arising from any use of this publication. Unless otherwise stated, any views, forecasts, or estimates are solely those of the author(s), as of the date of the publication and are subject to change without notice.
The distribution of this publication may be restricted by law or regulation in different jurisdictions and persons into whose possession this publication comes should inform themselves about, and observe, such restrictions.
Copyright and database rights protection exists in this report and it may not be reproduced, distributed or published by any person for any purpose without the prior express consent of ING. All rights are reserved.
ING Bank N.V. is authorised by the Dutch Central Bank and supervised by the European Central Bank (ECB), the Dutch Central Bank (DNB) and the Dutch Authority for the Financial Markets (AFM). ING Bank N.V. is incorporated in the Netherlands (Trade Register no. 33031431 Amsterdam).