Mapping the global lockdown
An index based on Google mobility data indicates which economies have so far been more or less affected by the lockdown. While differences are large, one thing stands out: this is truly a global symmetric shock like no other
In 2008, it was China and other emerging markets that bucked the trend of the global recession. During the dotcom crisis many European economies didn’t even officially go into recession. This time, it’s very different as it seems unlikely that more than perhaps a handful of countries have a fighting chance of avoiding a 2020 downturn.
To get a sense of how much the lockdowns are affecting economies, we use Google’s mobility data. The reports show data as the percentage change in visits to certain places like grocery stores, workplaces, and retail shops compared to a baseline (ie. the average of visits for the same day of the week between 3 January and 6 February). We have created indexes combining the three categories mentioned above and look at the average activity since 15 February to get a sense of the cumulative impact of Covid-19 on economies over time. While there are some challenges in comparing the countries, the data does provide an interesting first peek at how significant public lives have been affected by the softer and harder lockdowns.
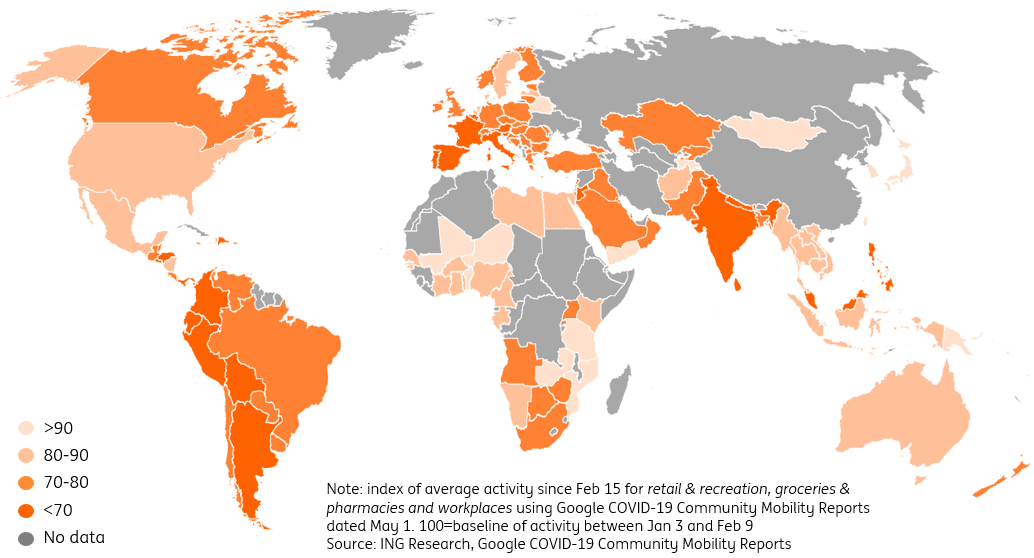
Chart 1: global map

Chart 1 shows that daily life has been interrupted very significantly across the globe. The countries with the most significant impact so far on retail, grocery stores and workplace visits have seen average activity drop by almost 50% since the beginning of the time series in February, which is well before most countries started their lockdowns. The most affected countries so far for which there is data available are Italy, Ecuador, Bolivia, Spain and Peru.
The limitations on daily life have been quite severe in many European countries, but the different approaches have resulted in a heterogenous decline in daily visits to retail, grocery stores and the workplace. Belarus has barely seen an impact and does not have a lockdown in place, countries like the Netherlands and Sweden have had relatively mild lockdowns, while France, Spain and Italy for example have seen full lockdowns for a significant period that are now very gradually being eased.
Chart 2: The lockdown has been very different over time for major economies
Note: index of average activity since Feb 15 for retail & recreation, groceries & pharmacies and workplaces using Google COVID-19 Community Mobility Reports dated May 1. 100=baseline of activity between Jan 3 and Feb 9
In North America, lockdowns seem to have had a milder impact on economic activity while daily life in Latin America has been significantly interrupted across the board. Brazil has had one of the milder impacts on the economy so far according to the index, in part due to the different approach taken by President Jair Bolsonaro.
Asia has seen a very different pattern to Latin America with some countries like India among the most severely hit according to the Google mobility data, while others like Korea, Taiwan and Japan rank among the most unscathed. The spread of the virus has been relatively contained in countries like Korea and Taiwan, while in Japan new cases have been on the rise recently. This has resulted in more disruptions to daily life in Japan as activity has been declining, as opposed to cautiously rising as in most advanced economies in recent weeks. Korea has actually seen cautiously increasing activity since the end of February and is almost back to activity levels seen in January. Australia started its restrictive measures relatively late, but has seen daily life about as impaired as it is in the US at the moment.
Download
Download article7 May 2020
Covid-19 pandemic: Entering the next phase This bundle contains {bundle_entries}{/bundle_entries} articlesThis publication has been prepared by ING solely for information purposes irrespective of a particular user's means, financial situation or investment objectives. The information does not constitute investment recommendation, and nor is it investment, legal or tax advice or an offer or solicitation to purchase or sell any financial instrument. Read more
