Malaysia: October trade surplus at all-time high
- 5 December 2018
- Malaysia
The external payments position will remain supportive of the Malaysian ringgit into 2019. But a widely expected global growth slowdown and the resultant double whammy to the economy from slower exports and lower commodity prices will be negative

| MYR 16.3bn |
October trade surplusA record high |
| Higher than expected | |
A record high trade surplus
Malaysia’s trade surplus widened to a record 16.3 billion Malaysian ringgit (MYR) in October from MYR 15.3 billion in September. A surprise 17.7% rebound in exports from a year ago contributed to the higher trade surplus even as imports also posted a significant positive swing to 11.4% annual growth from a 2.8% fall in September. Both export and import growth were way above the consensus estimates of 5.8% and 3.3%, respectively.
Electrical and electronics and commodity cluster (liquefied natural gas, crude petroleum, petroleum products, and palm oil) remained the main export drivers. A 60% surge in semiconductor exports stood out. Strong exports pulled imports higher as most of the (raw material) imports are processed for exports. By-products, electronics and electricals, crude and petroleum products, chemicals, metals, and transport equipment helped headline import growth.
Improved terms of trade
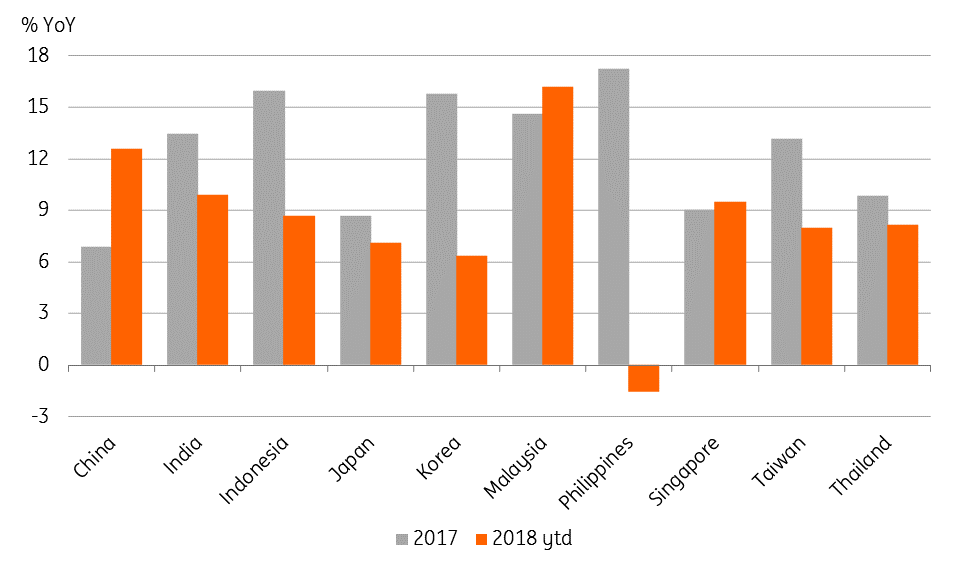
The year-to-date export and import growth rates of 7.5% and 5.4% have slowed sharply from over 20% a year ago. Yet, the USD-denominated 16% growth rate makes Malaysian exports Asia's star performers in the current year. Unlike most Asian economies, Malaysian export growth accelerated this year (see figure).
A wide gap between the MYR- and USD-denominated export growth rates is explained by the movement in the exchange rate. The average USD/MYR rate of 4.01 in the first 10 months represents a more than 8% appreciation from the average rate in the same period of 2017, though the currency was still down 3% from its end-2017 level. Stripping out the price effect, the year-to-date growth in the volume of exports halved to 6% from a year ago.
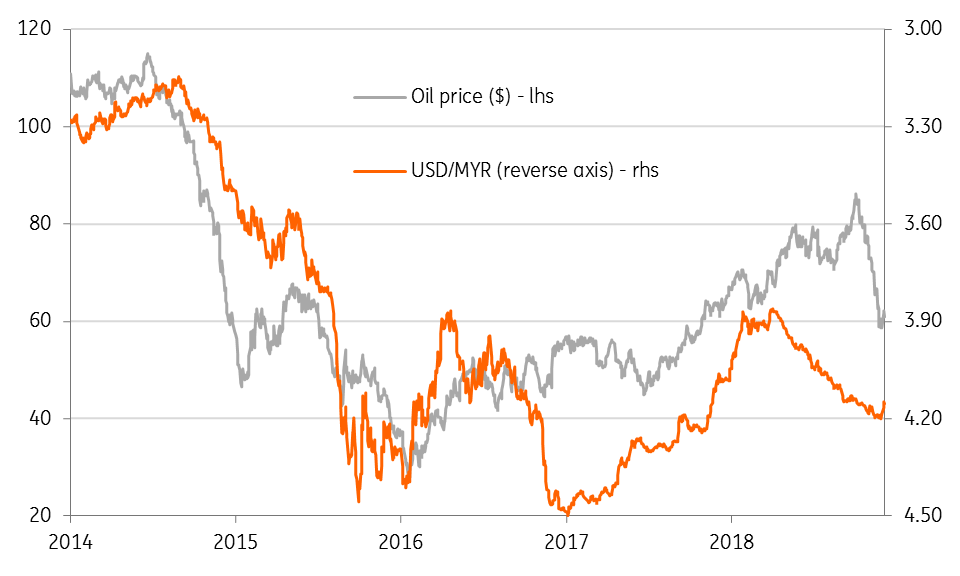
However, Malaysia’s export outperformance vis-à-vis other Asian countries in an environment of intensified global trade conflict this year may as well be ascribed to better terms of trade from higher commodity prices. Even as most of the oil price surge seems to be over, the $72/barrel year-to-date average oil price is still 34% higher than the average a year ago.
Asia: Export performance - Year-to-date 2018 vs. 2017
Positives and negatives for the MYR
The cumulative trade surplus of MYR 102 billion in the first 10 months was MYR 21 billion wider on the year. The trade surplus drives the current account surplus, though the latter shrank by MYR 3.7bn to MYR22.7bn in the first three quarter of 2018. We expect the full-year 2018 current surplus to be equivalent to 2.2% of GDP, down from 3.0% in 2017 but still far better than some other Asian economies (India, Indonesia, and the Philippines). We anticipate the current account surplus to remain within the 2-3% of GDP range in 2019, which is also the government’s projection for the year.
The external payments position will remain supportive of the MYR into 2019 but a widely expected global growth slowdown and the resultant double whammy to the economy from slower exports and lower commodity prices will be negative. Among other things, Malaysia's weak public finances are the key headwind to currency appreciation. Overall, we expect the economic outlook to be mildly negative for the MYR, guiding us to a view that the USD/MYR will hover near the 4.2 level through 2019 (spot 4.15).
Oil drives Malaysian ringgit
Content Disclaimer
This publication has been prepared by ING solely for information purposes irrespective of a particular user's means, financial situation or investment objectives. The information does not constitute investment recommendation, and nor is it investment, legal or tax advice or an offer or solicitation to purchase or sell any financial instrument.Read more
Included in the following bundle

Good MornING Asia - 6 December 2018
- This bundle contains 4 Articles