India: No respite for the rupee
- 15 August 2018
- India
As if the global market turmoil isn’t enough, domestic economic developments have been turning sour for the Indian rupee. This provides little hope for a break in the trend of the currency testing new lows against the US dollar. Prepare for more aggressive central bank policy tightening ahead
The Indian rupee (INR) exchange rate per US dollar surged to a record high of 70 when the Turkish financial crisis hit emerging market currencies hard earlier this week. As if the external drags on the INR aren’t enough, the domestic economic data -- a multi-year high trade deficit, elevated inflation, and signs of slowing GDP growth -- haven’t been any friendlier.
With an apparently shallow central bank (RBI) tightening cycle ahead, the current INR depreciation trend looks to be a prolonged one. The next challenge will be a string of state elections in the remainder of this year and general elections in 2019, which should see investors starting to add a political risk premium into local financial assets. As such, we don't rule out an aggressive central bank (RBI) policy tightening at the October meeting. Yet we see no threat to our 71.5 forecast for the USD/INR by end-2018.
| $18bn |
Trade deficit in JulyFive-year high |
Trade deficit at five-year high in July
India’s external trade deficit jumped to the highest level in five years, to $18 billion in July from $15.6 billion in the previous month. This was far above our forecast of a $15.9 billion deficit, while the consensus was centred on an even lower figure of $15.7 billion. The high trade deficit was due to import growth outweighing export growth for the second consecutive month. Imports grew by 29% year-on-year in July, beating our 26% forecast, while export growth of 14% YoY was in line with expectations.
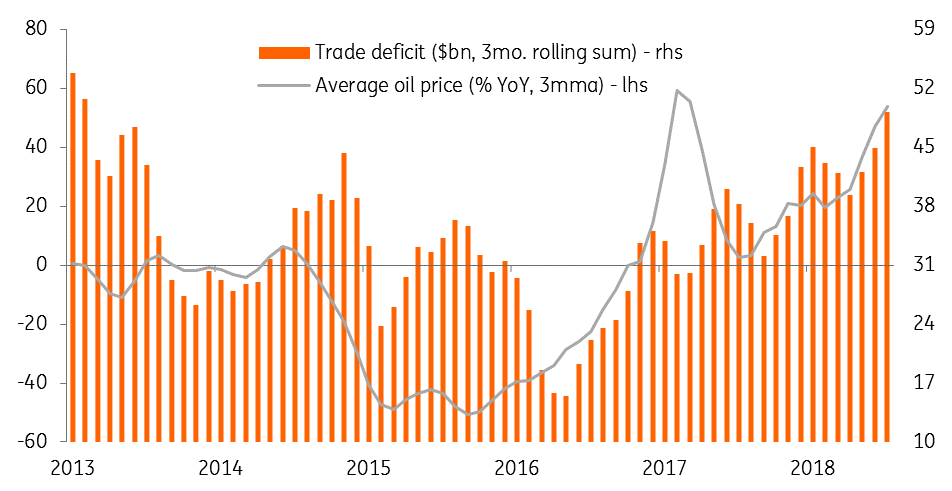
Oil imports, with a 58% YoY surge in July, remained the main driver of total imports. Even as global oil prices stabilised around $75/barrel in the three months through July, year-over-year oil price inflation remained on an upward trend, 52% YoY in July, causing the oil import bill to balloon. Therefore, oil has been mainly responsible for the higher trade deficit as is clear from the chart below.
The cumulative deficit in the first four months of FY2018-19 (starting April) was $63 billion, up from $51.5 billion a year ago. Nearly all of the widening over the year was due to oil trade. The trade balance drives the current account balance. We expect the current deficit to rise to 2.6% of GDP in the current financial year from 1.9% in the last year.
High oil price inflation is fuelling trade deficit
| 6.3% |
Core CPI inflation in JulyA four-year high |
Rising core inflation, slower GDP growth
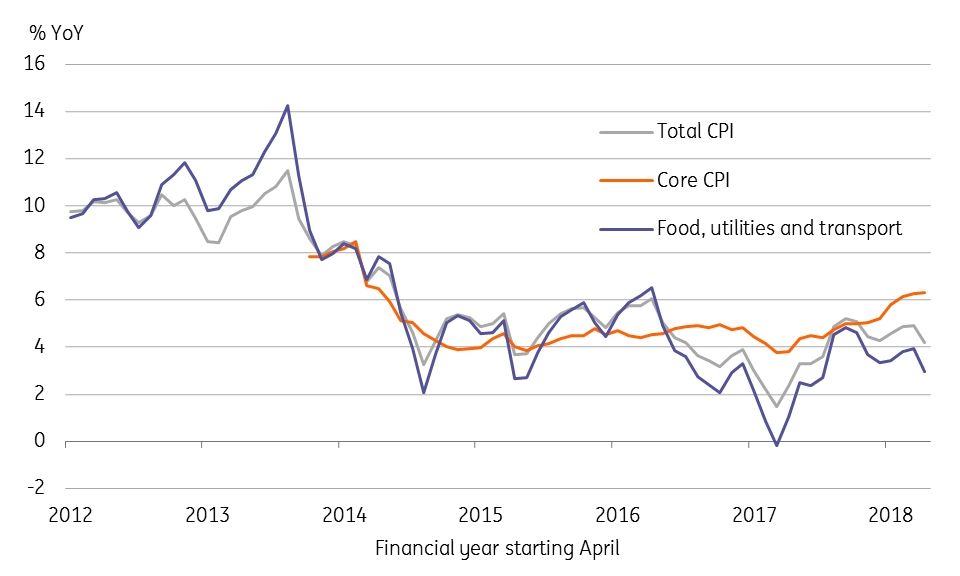
Consumer price inflation surprised on the downside in July, coming in at 4.2% YoY, while June’s figure was revised down to 4.9% from 5.0%. But the headline overshadowed a steady increase in the core measure to a four-year high of 6.3%. While central bank (RBI) policymakers aren’t letting their guard down against inflation, which will remain elevated due to several administrative factors apart from the high oil price, the ongoing currency weakness and higher trade tariffs will pressure inflation going forward.
And surprisingly strong industrial production data for June, with 7% YoY growth (although this is back-dated data), provides little solace. The average April-June IP growth is still slower at 5.2% from the 6.5% average in the previous three months. This foreshadows a slowdown in GDP growth in 1Q FY2018-19, not a good start to the year, the rest of which will remain exposed to greater global economic uncertainty and rising domestic political risk.
In the 2018 Article IV Consultation released last week, the IMF warned about sustained upward inflation requiring gradual monetary tightening. The Fund also warned about slower growth ahead resulting from adverse terms of trade and loss of real income to households and firms, while tighter monetary policy will hinder the recovery of credit growth and investments.
A month ago, we downgraded our GDP growth forecast for FY2018-19 from 7.2% to 6.7% (see ‘India: Downgrade of growth forecast’). We now increase our inflation forecast for the year from 4.7% to 5.0%.
Rising core inflation
Authorities accommodating INR weakness
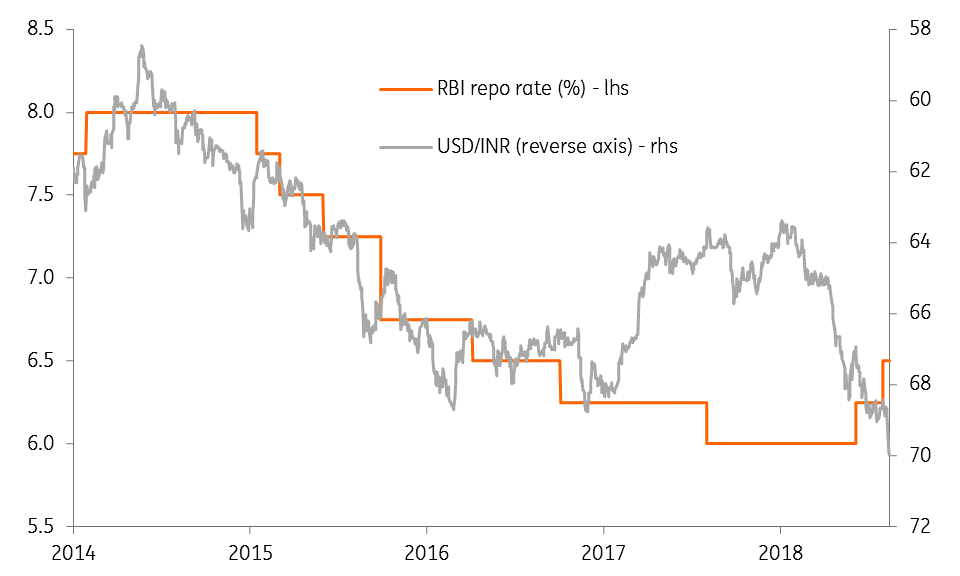
The INR’s 8.6% year-to-date depreciation is the steepest among Asian currencies, of which 7% has occurred since April. A $20 billion fall in foreign exchange reserves in the last four months to $404 billion through July is a testament to the RBI’s presence in the market to support the currency. This is still a sufficiently large stock of reserves, though the authorities concede that any intervention will not do much to stabilise the currency when it’s due to global factors.
Even if the rupee falls to 80, it will not be a concern provided all other currencies depreciate. – Subhash Chandra Garg, secretary of India’s Economic Affairs Department
And with local factors also kicking in now, it might take a more aggressive policy response to rein in INR weakness. Just as in other Asian countries (Indonesia and Philippines), a weak currency was the principal force behind two 25 basis point RBI policy rate hikes in June and August. Will the RBI follow central banks in Indonesia and the Philippines in pursuing aggressive policy tightening? Or, on the contrary, will the central bank take the currency weakness in stride as a factor required to curb imports and the trade deficit, even though this would also be inflationary. This poses a significant policy challenge for the RBI going forward.
Prepare for an entrenched RBI tightening cycle
Likelihood of more aggressive RBI policy tightening
An apparently shallow RBI tightening cycle based on current domestic economic conditions could become entrenched in the event that global currency turbulence intensifies, which remains a risk if the US delivers on its planned $200 billion worth of tariffs on China.
While we maintain our forecast of one more 25 basis point RBI policy rate hike at the next meeting on 3-5 October, we don’t rule out the RBI doubling it up. Not only that, we now add to our policy forecast a further 50 basis points of rate hikes in 2019.
Will this stem the INR weakness? Besides external and domestic economic factors, politics will be an added overhang on the currency as a string of state elections in the remainder of the year culminates in general elections by mid-2019. With investors starting to add a political risk premium into local financial assets, any relief to the currency from higher interest rates will be transitory. This should keep the USD/INR rate on the path towards our 71.5 forecast for the end of 2018.
Economic Forecast Summary

Content Disclaimer
This publication has been prepared by ING solely for information purposes irrespective of a particular user's means, financial situation or investment objectives. The information does not constitute investment recommendation, and nor is it investment, legal or tax advice or an offer or solicitation to purchase or sell any financial instrument.Read more
Included in the following bundle
In case you missed it: The contagion effect
- This bundle contains 8 Articles