India: Why we’re now looking for two rate hikes this year
- 9 July 2018
- India
We expect the India central bank (RBI) to hike rates at the August meeting and again in October, taking the policy rate to 6.75%. We see USD/INR trading toward 71.5 by end-2018

A slew of Indian economic releases over this week and next will set the expectation-agenda for the Reserve Bank of India's policy for the rest of the year. While we continue to expect the RBI to raise the policy interest rates by 25bp at the next meeting on 1 August, we have added one more hike at the October meeting to our policy forecast. We're looking to a USD/INR exchange rate at 71.5 by end-2018 (spot 68.7).
| 5.4% |
CPI inflation in JuneING forecast |
Inflation above 5%, again
June consumer price data due Thursday is likely to show the year-on-year inflation rate accelerating above 5%, a level last seen in December and January, from 4.9% in the previous month. We're forecasting 5.4%, which is above the consensus of 5.25%. The main culprits remain food and oil-related fuel and transport costs. While both the CPI components are bouncing off the low base from a year ago, the weak currency and the pass-through from high global oil price are strong factors here.
The base effect will turn favourable (for a lower year-on-year inflation reading) as soon as July. But other factors together with administrative measures and the hike in minimum support prices for farmers will continue to pressure inflation higher in the remainder of the current financial year 2018-19 (April-March). The RBI forecasts inflation in a 4.8% to 4.9% range in the first half of the financial year and at 4.7% in the second half.
The wholesale price inflation data for June is due next week (Monday, 16 July) and we're forecasting an increase to 5.3% from 4.4% in May.
Food and fuel prices drive inflation

| 5.8% |
Industrial Production in MayING forecast |
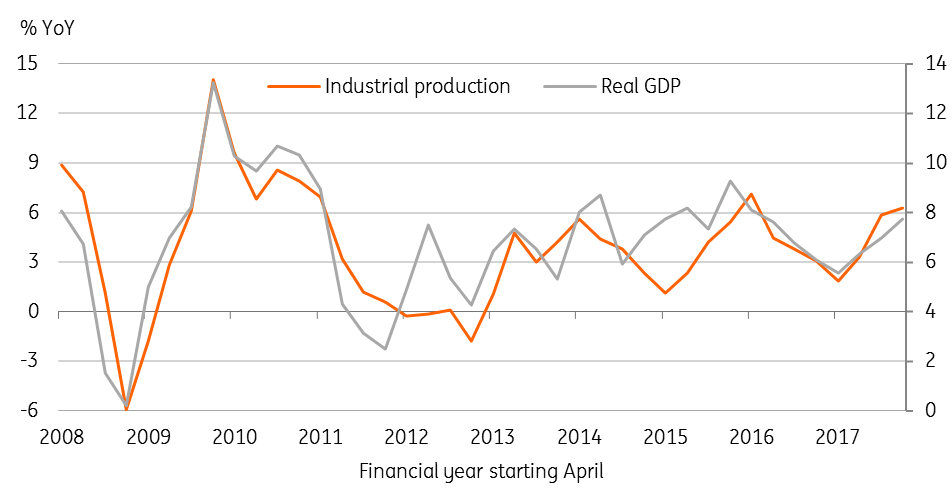
Moderate GDP growth
Industrial production data for May, due on the same day as the inflation numbers, will be pored over to get a sense of the direction of GDP growth in the first quarter of FY2018-19. As we already know, the growth of output in core industries (eight infrastructure industries) slowed to 3.6% in May from 4.6% in April, which points to slower overall IP growth. However, strong exports in May, up 20% YoY, prompt us to forecast a faster IP growth of 5.8% YoY than 4.9% in April. And we aren’t alone; the consensus forecast is 5.9% growth.
However, with this forecast, the average April-May IP growth of 5.3% will still be slower than 6.3% average in the previous quarter. And June typically is a weak IP month. As a result, a modest slowdown in GDP growth in the last quarter can’t be ruled out. We forecast 1Q FY2018-19 GDP growth of 7.5%, consistent with the consensus view and down from 7.7% in the previous quarter. GDP data for 1Q isn't due until mid-August.
GDP growth closely tracks industrial production growth
| $15.9bn |
Trade deficit in JuneING forecast |
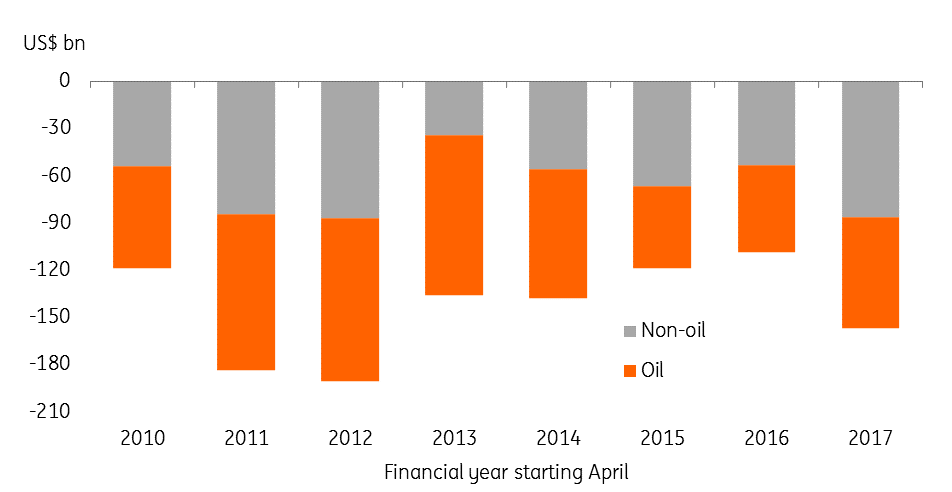
Widening trade deficit
The external trade data for June is due sometime between 12-15 July, where our attention will be on the trade deficit figure. We consider the consensus of a slightly narrower deficit of $14bn than $14.6bn in May subject to upside risk. Our forecast of $15.9bn deficit results from expectations of a near-halving of export growth to 11.0% YoY from May but steady import growth of around 15%. If that happens, the deficit in the first quarter of the financial year 2018-19 will be $44.2bn, or $4.1bn wider than the quarter a year ago.
The $157bn annual trade deficit FY2017-18 was the largest in the last five years and little under half of that, $70bn, was from the oil trade. With trade war sentiment weighing on future exports and rising oil prices, and strong domestic demand boosting imports, we're looking at another year with a large trade deficit in FY2018-19.
Oil drives trade deficit
Policy implications
In June, the RBI joined its Asian counterparts (in Indonesia and the Philippines) in raising the policy interest rate to stem the depreciation pressure on the Indian rupee (INR). This has helped the INR to some extent, turning it from an Asian underperformer earlier in the year to an outperformer in the recent sell-off. But there was no end to the weakening trend that’s likely to persist in the near-term as the trade war risk works its way through the actual trade figures.
We have added one more rate hike at the October meeting to our forecast
With inflation poised to overshoot the RBI’s forecast, another rate hike at the next policy meeting on 1 August looks like a done deal. That’s not all. We have added one more rate hike at the October meeting to our policy forecast, taking the policy rate to 6.75% by the end of the year. Higher interest rates should hold the ground under the INR, though other key negatives including persistently high inflation, a trade war, and wider current account and fiscal deficits will remain in play for the rest of this year. Add to this the political risk premium in the run-up to general elections in early 2019. We now see USD/INR trading toward 71.5 by end-2018 and further to 72.8 by mid-2019 when the political risk will have intensified (spot 68.7).
Content Disclaimer
This publication has been prepared by ING solely for information purposes irrespective of a particular user's means, financial situation or investment objectives. The information does not constitute investment recommendation, and nor is it investment, legal or tax advice or an offer or solicitation to purchase or sell any financial instrument.Read more
Included in the following bundle

Good MornING Asia - 10 July 2018
- This bundle contains 3 Articles