Hungary: The best might be over
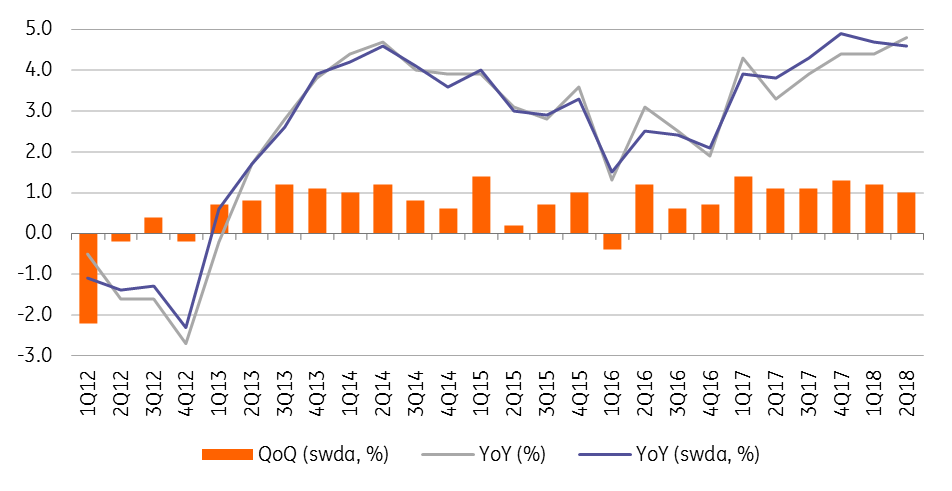
At 4.8%, Hungary has posted its highest growth rate since 2004. The details are full of puzzles, but there are signs Hungary could well be over its peak. Expect economic activity to slow down over the coming months but for now, we maintain our forecast of 4.3% growth in 2018
| 4.8% |
GDP growth (YoY)Consensus (4.6%) / Previous (4.4%) |
| Better than expected | |
The detailed 2Q18 GDP release caused an upside surprise as the Hungarian Central Statistical Office (HCSO) changed the advance reading by 0.2ppt to 4.8% year on year. This means that Hungary has posted its highest growth rate since 2004. However, seasonally adjusted data (both YoY and QoQ) still shows that the economic performance is slowing down.
Hungarian GDP growth

More balanced performance on the production side
On the production side, we can see some surprises as the value addition of services increased at a slower pace of 4.3% YoY in the second quarter. Despite the slow down, services provided a 2.3ppt contribution to GDP growth, the highest among all sectors.
Industrial data provided the biggest contradiction. The monthly production data suggested a moderate slow down, while the sector expanded on an added value basis of 3.6% YoY and expanded at a higher pace than in the first quarter. One possible explanation for this can be the significant wage growth in the sector, which drives value added but not the output. Another puzzle in this is that despite the strong industrial performance the contribution of net exports in GDP growth turned out to be negative (-0.5ppt). It seems that domestic consumption eats up a higher share of industrial production and companies increased their inventories via imports.
Surprisingly, growth of services decelerated, but remained the main contributor
Construction accelerated to 23.7% YoY in 2Q18 despite the high base, but still driven mainly by the drawdown of EU funds, which means infrastructural projects. The contribution of industry and construction together to GDP growth was 1.7ppt, so the growth structure has become a bit more balanced. Agriculture also provided some positive surprises with its 3.2% YoY growth, contradicting the bad news from the sector.
The contribution of net taxes on products reached a remarkable 0.7ppt. As this is the government's income, we see this as a sign of the increasing extra revenue due to the combination of two things: (1) strong economic performance and (2) the retreat of the shadow economy.
Contribution to GDP growth – production side (% YoY)

Surprising slowdown in consumption and more puzzles
Taking into consideration the expenditure side, the main drivers behind GDP growth have remained domestic factors.
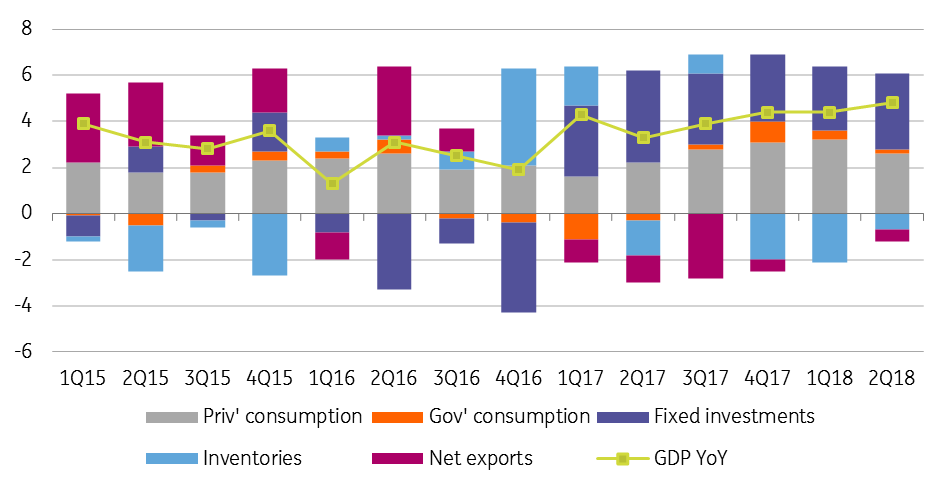
The domestic use (consumption and investments) added 5.4ppt to annual GDP growth, which means net exports had a negative contribution reaching almost 0.5ppt. Within the domestic use, private consumption slowed down to 4.3% YoY growth, causing a mild surprise. Meanwhile, the expansion of government consumption also slowed down to 1.9% YoY. Overall, final consumption marked a 2.8ppt contribution to economic activity.
In contrast with the strong performance in the construction sector, investments decelerated and rose by 15% YoY in 2Q18 versus 17.1% in 1Q18. Despite the slowdown, gross fixed capital formation had a higher contribution to GDP growth (3.3ppt) than in the first quarter (2.8ppt), which qualifies as the biggest puzzle of this data release.
Domestic demand remained the main driver as effect of net export came in negative
So overall, we saw a slowdown in consumption and investments, but import activity increased significantly, showing a 7.5% YoY growth.
In line with the surprisingly strong industrial performance, the export activity also rose by 6.2% YoY. This difference translated into the negative net export contribution. The final puzzle involves inventories, having a negative effect on GDP (-0.7ppt), but somehow translated into a positive factor, when it comes to the domestic use, as this is the only factor which could accelerate the domestic use compared to the previous quarter as all of the other contributors showed a deceleration.
Contributions to GDP growth – expenditure side (% YoY)

Economic activity is over the peak
We expect economic activity to slow down in the coming quarters, based on our LeadING HUBE indicators. Moreover, seasonally and calendar adjusted data, both in year-on-year and in quarter-on-quarter terms suggest the slowdown has already started.
We maintain our 4.3% YoY forecast in 2018
Slow down in consumption and retails sales turnover back up this story too. Going forward, we expect significant revisions - correcting the 2017 base and this year’s figures and solving all of the puzzles. Against this backdrop, we are not ready to change our 4.3% YoY forecast in 2018 as a whole.
This publication has been prepared by ING solely for information purposes irrespective of a particular user's means, financial situation or investment objectives. The information does not constitute investment recommendation, and nor is it investment, legal or tax advice or an offer or solicitation to purchase or sell any financial instrument. Read more
