Coronavirus: Slumping tourism will cost Asia up to $115bn this year
- 24 February 2020
- China
Holidays in Hell: The impact of the Covid-19 virus on economies in Asia is potentially huge, as tourism in the region takes a beating. Here, we attempt to quantify the hit to GDP

We are getting quite used to seeing footage of tourists stranded on cruise ships as the Covid-19 outbreak leads to aggressive attempts at containment. One thing is very clear, travel and tourism in Asia are taking a beating. From deserted hotels to empty airports, the impact of this little scrap of protein and lipid on economies in the region is potentially enormous. In this note, we set out a process to estimate the loss of Asian GDP through lost tourism receipts alone, and come up with a total figure of $105-115 billion.
It’s far too early to speculate how far this Covid-19 outbreak will go. But barely two months into this epidemic and the ramifications are already far-reaching. Parts of China are in a literal lockdown, and there is very little travel between China and other parts of Asia. Where this still occurs, screening and quarantine procedures are in place. Few if any Chinese travellers will consider a two week lockdown an acceptable price for a similar length vacation elsewhere in Asia, and not surprisingly, Asian tourists are also notable by their absence in China.
What we're measuring
Our approach will be to cost the impact of Covid-19 in terms of Gross Domestic Product (GDP). GDP is usually measured in terms of expenditures, so if someone doesn’t go on holiday, and doesn’t spend a hypothetical $1000 on that holiday, although that $1000 does not disappear and is still sitting in their bank account, the hypothetical recipient of those expenditures now receives nothing.
If we assume that tourism to and from China basically grinds to a halt in 2020, and extra-regional tourism also diminishes, then the cost to the region from lost tourism revenues alone is approximately $105-$115 billion. If this doesn’t sound sufficiently scary, bear in mind that tourism is just one of the channels through which the coronavirus can weaken the GDP growth of Asian countries grappling with this epidemic.
We will take a couple of sweeps at this subject before honing in on our final estimation. Looking at where Chinese tourists have stopped visiting is part of, though clearly not all of the story. But it is the simplest place to start.
We also need to consider how the Covid-19 outbreak is affecting other travel in the region. China is both a visiting nation and a visited one. To do the analysis properly, we also ought to consider spending by outbound tourists to China, as well as the inbound Chinese tourists that will no longer be visiting them. Finding reliable data to make such comparisons has not been easy, and we have had to make some simplifying assumptions.
For an individual nation, tourism is both an import and an export, and net tourism expenditure is what gets put into their GDP calculation. For some of the less developed Asian economies, tourism is predominantly an export, and gross revenues are the real issue. So we will also show measures such as revenues as a percentage of total exports and employment in tourism as a percentage of total employment for different economies in the region.
Furthermore, we won’t forget that not all travel in the region is either to or from China, even though about 40% of it is. Of the remainder, a similar amount is non-China intraregional, and only about 20% from outside the region. We have to also consider how these tourism flows will be affected.
China outbound travel
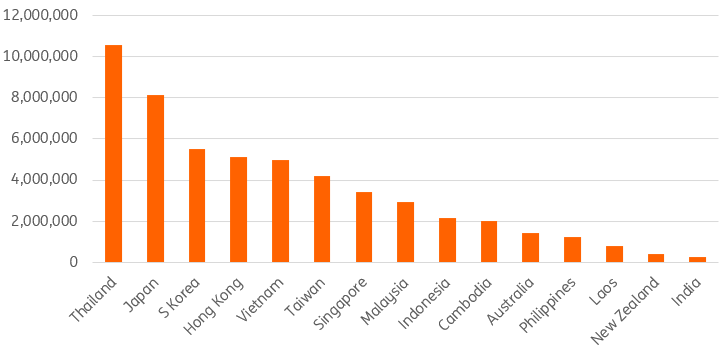
We start by looking at Chinese outbound travel. In other words, which countries are most visited by Chinese tourists and business travellers. In 2018, Residents of China made more than 53 million overseas visits to other parts of Asia. The very clear “winner” in all of this was Thailand with more than 10 million visitors from China. This was followed by Japan, South Korea and Hong Kong, and then not far behind, Vietnam.
Outbound travel for China is dominated by tourism, rather than business travel. And while tourism sites differ in their explanations for what factors drive these tourist flows, these days, "experience" is usually towards the top, along with dining opportunities. Shopping is still high up the list of driving causes but is by no means the main push factor. Whatever the explanations, Thailand clearly offers them in abundance.
Visitor arrivals from mainland China 2018
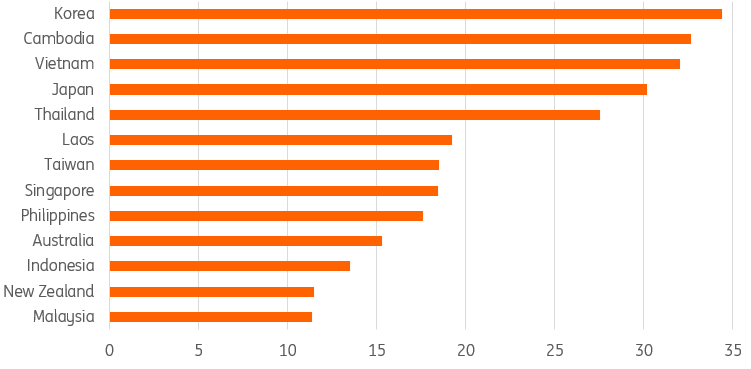
While Thailand tops the poll for the region as a whole in terms of pure numbers, Chinese tourists are still a very important source of income for other South East Asian economies. Considered as a proportion of all inbound tourists, Chinese visitors account for a much larger proportion of arrivals to Cambodia and Vietnam, with Laos not too far behind.
Interestingly though, when you look at Asia-Pacific as a whole, it is South Korea that stands out, with China accounting for 34% of all arrivals. Japan is not far off at just over 30%, with Cambodia and Vietnam also near the top, along with Thailand in fifth place at 27.5% (2018 figures). These differences probably reflect the fact that Thailand is more of a global tourist destination, diluting some of the impacts of regional tourism flows.
China tourists as % total
Asian tourism to China
To put these South Korean figures into a more appropriate perspective, we should note that a developed economy like South Korea is also characterised by a great deal of outbound tourism. It turns out that South Korea tops the Asian league table for tourist departures to China, with an impressive 4.2 million outbound tourists in 2018. That's 50% more Korean tourists to China than from Japan or the United States.
Tourist Arrivals in Mainland China

In net terms, in 2018 there were only about one million more Chinese visitors to Korea than Korean visitors to China. For Korea, that may soften the blow to GDP from lost Chinese tourism revenues, especially if Koreans don’t just travel elsewhere instead.
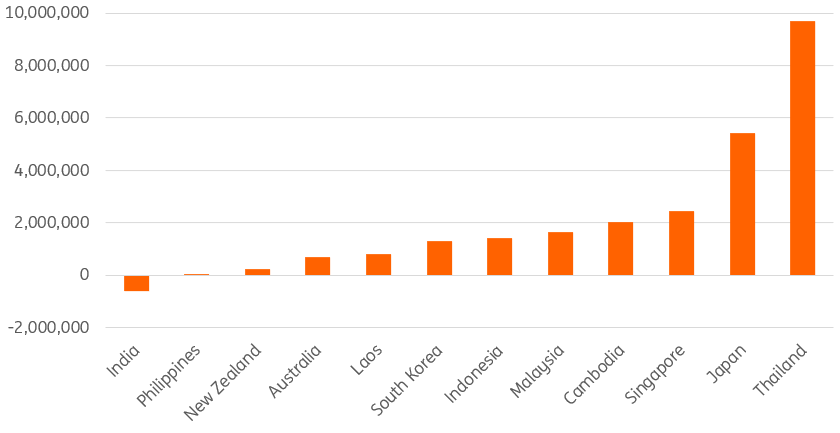
Looked at in this way, South Korea drops right back down the table with very limited net travel to China, though Japan and Thailand still stand some way up from the rest of the region with a still very substantial net inflow of Chinese tourists. Net tourist figures may suggest that some economies will experience a smaller hit to GDP than others. But if other Asian countries also stop visiting China, this is also a loss of GDP when considered at a regional level. We need to add both inbound and outbound travel between China and the rest of Asia to come up with the potential impact of the coronavirus.
Net tourism 2018
Revenues from tourism
In addition to absolute flows of tourists to and from China, we also need to have some idea of the relative spending power of tourists arriving from China, compared to those visiting it. We don't have great data here. Some countries in the region do provide some spending figures for tourists from different countries. For example, according to Australian tourism statistics, Chinese tourists spend considerably more than visitors from most other nations.
Anecdotally, Korean media reports that many Chinese visitors travel to department stores to buy luxury goods or jewellery for re-sale back in China, reflecting the different prices of these goods there. An article in the China Daily newspaper reports that Chinese tourists in 2018 spent nearly $128 billion in 149 million overseas trips. That works out at about $850 per tourist.
Similarly, recent Singapore data shows 3.4 million visitors from Mainland China spending $3.9 billion, an average of just over $1000 per visitor.
For visitors to China, the data is even less clear. A Travel China website puts inbound visitor revenue at about $123 billion from 140 million trips, a little less than $1000 per visit.
The United Nations World Tourism Organization gives average revenues per visitor for all the countries we are interested in, so by multiplying visitor arrivals by average revenue, we can calculate revenues for both outbound and inbound Chinese tourism.
One big advantage of the United Nations World Tourism figures is that they provide a comparable set of figures across the whole region. What they don’t do, however, is show receipts by country of tourist, only average revenues. To take account of the high spender characteristic noted for Chinese tourists, we have adjusted the average visitor receipts upwards by 25% for each country to reflect this. This is one of many possible sources of error in these estimations.
Tourism receipts and net revenue
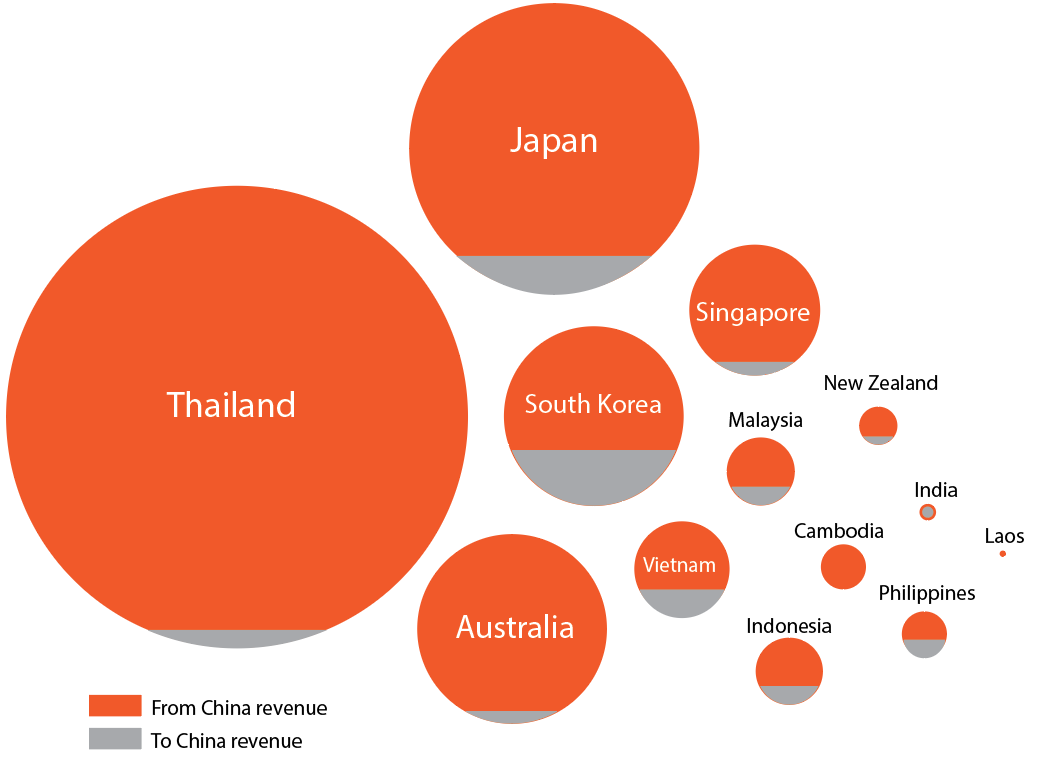
To calculate the total loss stemming from Covid-19, we have assumed zero tourism receipts for Asian countries from inbound China visitors. That's obviously a gross simplification, but it fits a scenario where the epidemic lingers long after it peaks. Official travel restrictions may be slow to be removed, and travellers may remain wary long after it is safe for them to travel again.
For Asia as a whole, we also need to add the outbound spend to China, which we also assume is lost in its entirety. In other words, we only net out at the country level, for Asia as a whole, this is all spending that is not happening. All GDP lost. That works out as a loss of $74 billion in inbound Chinese tourism receipts, plus a further $10 billion in lost Chinese receipts from deferred Asian tourism for a total of $84 billion.
80% of tourism in Asia is intra-regional, so if we want to scale this up to include losses stemming from non-China tourism within, and from outside the region, we will need to make some further simplifying assumptions.
There will continue to be non-China intra-Asian tourism. But with many countries in the region having some coronavirus issues, even this tourism is likely to be dampened. With non-China intra-Asian tourist flows about the same as those involving China, we assume a 25% reduction in revenues from this source, rather than the 100% loss we assumed for China. That adds a further $21 billion to our total.
A further $10 billion is an arbitrary modifier to take care of net losses stemming from extra-regional tourism losses (e.g from the US, Europe etc). This takes our grand total to $115 billion.
Note, here, with this final modifier, it is the net loss that counts as we are considering tourism outside the region. If tourists from Asia are also deterred from travelling outside the region given the reception they feel they may receive elsewhere, that may mitigate some of this modifying addition and introduce a further potential source of error.
Leaving out this last $10 billion would, on the one hand, dismiss the potential for further losses outside the region. On the other hand, a more methodically worked estimate is not likely to be large enough to warrant the additional effort involved. We leave it to the reader to decide whether or not to include it, which is why we present the total as a range, rather than a single figure.
Finally, we acknowledge that the expenditures we are measuring do not necessarily represent GDP losses, as those are derived from the value-added of expenditures, not total receipts. But as we are in most cases looking at spending on final services and products, those figures probably aren’t a bad approximation, and our use of 2018 figures also adds in a little conservatism that will hopefully net out some of the measurement error that creeps in from additional sources such as these.
In the end, such estimations are intended to shine a light onto potential losses, not provide a surgically precise forecast.
What use are such estimates?
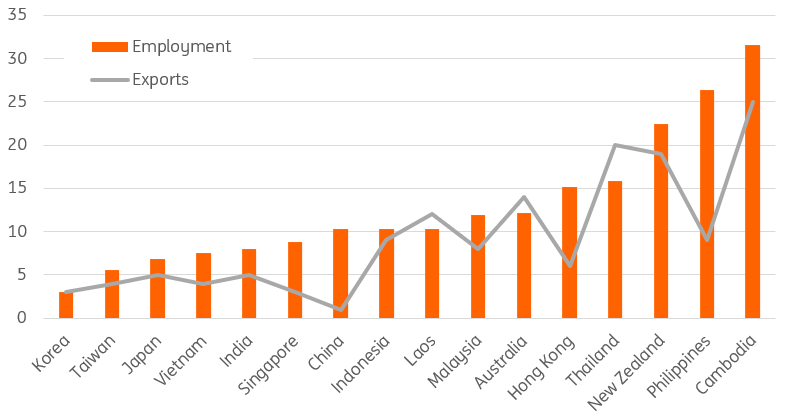
Estimates of GDP loss like this are also a proxy for the threat to employment in these economies. What becomes apparent when you examine the proportion of exports accounted for by travel and tourism, and the proportion of employment that is accounted for by this sector, is that there is a very close, almost unitary relationship.
What's interesting here, is that although some of the developing economies of SE Asia are represented at the very top of this comparison, namely Cambodia and of course Thailand, others, such as Vietnam have clearly gone down a different development route, with manufacturing accounting for more employment and exports. Laos is somewhere in the middle, perhaps hampered in becoming more of a tourist hotspot by its lack of coastline.
The big numbers in terms of the GDP loss from this analysis came from the large developed economies of Japan and South Korea, but in terms of the proportion of exports and employment that this represents for them, it is not such a big deal. But this analysis has dealt with only one channel for Covid-19 to affect economic activity. Japan and Korea may face other issues, such as supply chain disruptions in industry. So they are not off the hook.
Furthermore, the employment distinction doesn't fall neatly along income and development lines, with New Zealand, Australia and Hong Kong towards the more exposed end of the chart.
Time will tell the reach and extent of the economic damage that Covid-19 ultimately wreaks. Hopefully, this note will prove helpful for those crafting responses to combat its effects.
Employment and exports related to tourism as a % of total
Sources
Chart 1, 2
https://kto.visitkorea.or.kr/eng/tourismStatics/keyFacts/visitorArrivals.kto
https://statistics.jnto.go.jp/en/
http://www.tourism.australia.com/content/dam/assets/document/1/c/0/i/f/2240151.pdf
https://partnernet.hktb.com/sea/en/research_statistics/index.html
http://tourism.gov.in/sites/default/files/Other/India%20Tourism%20Statistics%20at%20a%20Glance%202019.pdf
https://asean.org/?static_post=tourism-statistics
https://www.stats.govt.nz/topics/tourism
Chart 4
All of the above + Stastita
Content Disclaimer
This publication has been prepared by ING solely for information purposes irrespective of a particular user's means, financial situation or investment objectives. The information does not constitute investment recommendation, and nor is it investment, legal or tax advice or an offer or solicitation to purchase or sell any financial instrument.Read more
Included in the following bundle

Good MornING Asia - 25 February 2020
- This bundle contains 7 Articles