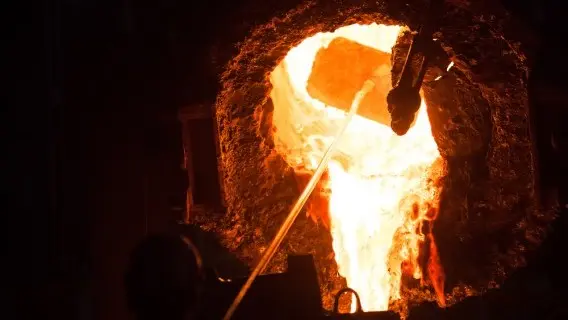
Metal price outlook: When the going gets tough…
- 18 July 2018
- Commodities daily
Escalating trade tensions and fears about the impact on global growth, and with it metals demand, have wiped 15% off the industrial metal index from its June peak. But keep calm, we expect the rhetoric to die down after the US mid-terms and prices to recover

A disappointing year-to-date for the bulls
At the end of 2017, it all looked so bright for commodities. Macro themes of higher inflation and synchronised global growth provided a solid backdrop for commodities as a broad asset class. Being long the basket was a popular strategy and as funds built allocations through December 17, a brief return of correlation was ushered in, as prices went up across the pack.
But disappointment soon set in and with it, cross-commodity correlation has lulled once again.
Earlier in the year, Chinese demand wobbled amid a longer than expected New Year slowdown. This was a temporary blip but enough to reinstate copper back below $7k, with evident signs of macro funds already losing faith and liquidating positions.
That move has since been eclipsed by a 16% drop following the G7 summit, as a tit-for-tat trade war undermines the initial premise of synchronised global growth. Unlike the first quarter however, the recent sell-off has been different. It has spread beyond just a liquidation of what was already fairly flushed-out fund longs, to now also inviting a hoard of fresh shorts that are actively chasing a collapse in base metals.
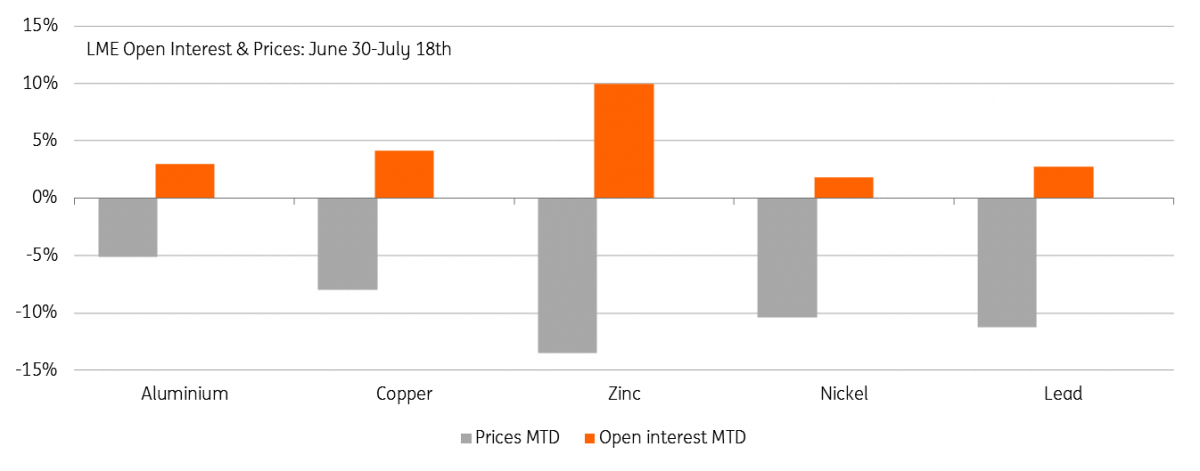
This is evident through the increasing open interest on the LME through the turmoil of the first half of July. Shorting zinc ranks at the top but it's certainly a common trend across the base metals. We think there is a high likelihood for a decent size rebound as those shorts take profits and cover positions, but we acknowledge it will largely be the sentiment around trade wars that will take the steer for the next quarter, at least.
Our forecasts, therefore, see a slight short-covering rebound from spot in the third quarter, but we still see prices remaining largely depressed through the quarter, as our economists expect President Trump to stick to his hard-line trade rhetoric in the run-up to the November mid-term elections.
Thereafter, it gets more plausible that a deal or compromise is sought, so most price improvement should come about in the fourth quarter. Our trade economist has identified fairly minimal direct impacts to GDP from the trade tariffs (and with it minor impacts to metal demand) unless an all-out US vs. the world trade scenario unfolds. Moreover, it’s the indirect hits to business and market sentiment that pose the biggest risks and that should let up with the rhetoric. The Shanghai Stock Index shows the damage done in the meantime and is down 10% since the start of June.
If you agree with our thesis that much of this trade war gloom will roll over, then metals certainly stand a good chance of recovering. The rebound will be aided by a reversal in the dollar as those safe haven flows into the greenback die down and critical US issues return to the fore (twin deficits, tight mid-term elections etc). ING’s FX team predict the dollar at 1.23 against the euro by year-end, going down to $1.35 by the end of 2019. But we don’t think metals will recover their losses so quickly. The physical trends for many metals are pretty tepid so might not provide much in the way of direction.
LME open interest rises through the July turmoil as funds build short positions
Aluminium: Waiting for Rusal
Our base case now assumes Rusal will achieve a deal co-ordinating the lifting of US sanctions sometime in the third quarter. The reshuffling of executives and extended share/debt trading between Rusal and EN+ show the ongoing attempts to appease OFAC. The key news to watch will be whether Oleg Deripaska relinquishes his stake suitably below 50%. We are aluminium bulls but think it's most suitable to go long after the market digests the news that Rusal supply is returning to the market unsanctioned. Conversely, if we did get towards the end of the third quarter without a deal, our bull case expects another frenzy, with prices touching close to $3,000 once more.
With Rusal’s expected return to the market, any dips below $2,000 should be seen as especially cheap. We were aluminium bulls before Rusal sanctions and remain so. We think the fourth quarter would still show some tightness as it takes time for buyers and financing for the flow of Rusal material to resume, but thereafter an upward trend should take hold. We see deep deficits ex-China for primary metal that surpasses potential semis exports. As high physical premiums continue to surpass lower warehouse incentives, we expect more frequently sharp backwardations on the LME, like the extreme July-August backwardation just past. Each backwardation will raise LME prices by squeezing out short position holders including those hedging off-warrant stockpiles that will gradually be liquidated.
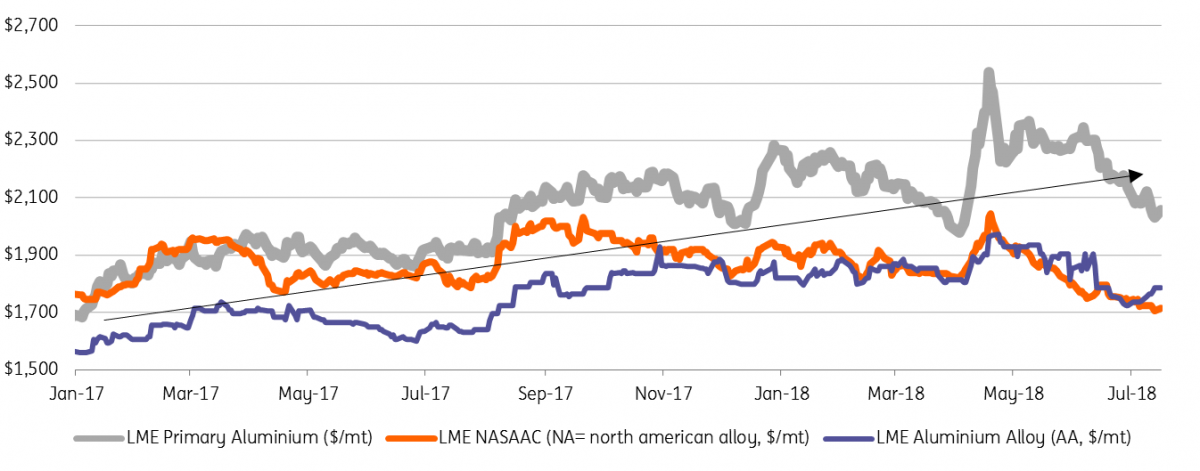
The ultra aluminium bears have pointed to growing scrap supplies, especially in the US, which they say will cannibalise demand. But we think it's still a question of whether it's the right type of scrap. The USGS reports that US aluminium scrap consumption was actually down 3% year on year in Jan-April. For now at least, scrap availability is seeing aluminium alloys underperform rather than dragging on primary prices. For example, primary aluminium prices on the LME are up 22% since January 2017 but NASAAC (North American Aluminium Alloy - A380) is down 3%.
Aluminium background:
High scrap drepresses aluminium alloy prices, not primary ($/mt)
Copper: Gradual rebound expected
Copper’s diversified demand base (geographically and by sector) made it a prime target for concerns over the trade war impact on growth. Therefore it should also attract a decent amount of dip buying and short covering, should those tensions resolve. But we don’t think it will fully regain its $7k standing for a while because we see a lack of significant direction from the physical market.
In particular, whilst imports into China are strong (+16% YOY), the signals are more push than pull: premiums have dropped, SHFE is in contango and stocks have barely drawn since the New Year. We argued the backwardation, which appeared on the LME in May-June, was more technical than fundamental and are not surprised to see that a wide contango has resurfaced.
Supply themes are also fairly tepid. All eyes are on Escondida negotiations but disruption rates so far are running low so it would take an extreme duration to swing the balance significantly. We expect any near-term tightness to come from a withdrawal of scrap supplies, which is already reported in the US. More generally, we look to the higher western premiums to provide support where the Chinese market is lacking.
We don’t see any reason why the strong flow of units into China should stop though. That is partly, of course, predicated on our view for a trade deal. Otherwise, copper might be particularly exposed to the demand via manufacturing exports. But even without this, our China economist is still optimistic for economic growth in the second half given supportive fiscal/monetary measures implemented by the government: RRR, VAT cuts etc. ING now expects GDP to be 6.6% in 3Q and 6.5% in 4Q, revised down from 6.7% on trade concerns but still far from devastating.
Into 2019 then, failing an all-out US vs. the world trade war, we expect the fundamental rationale to resurface that copper should trade above the incentive price for new mine supply (>$6,800/mt). Post-2020, a lack of new mine supply will transition from a deficit in concentrates into refined metal, and prices are expected to trade higher in anticipation of the shortage. Closing the 500kt+ shortfall expected by 2023 on a topdown approach requires a 2% hit to GDP and this runs way beyond any trade war expectations.
Copper background:

Nickel: Don’t let the facts get in the way of a good rally
We have been wrongly sceptical on nickel for much of the year. But while we still suspect the rally will start to lose momentum, we are more comfortable with the higher prices. We were previously concerned with a squeeze on stainless steel margins because the Chinese stainless steel prices hadn’t passed through surging costs. We also continue to believe that the draw on visible exchange stock is over-running any actual deficit. But don’t let the facts get in the way of a good rally. Speculators have driven nickel up 25% since December 2017 but we no longer see any fundamental response to necessitate a correction.
Firstly, Chinese stainless steel producers have proved resistant to climbing LME nickel prices. Along with the backward integration, it is safe to say we underestimated the degree that nickel-pig-iron (NPI) and refined nickel prices could diverge. NPI went from a premium value to discounts as high as $1500/mtu, alleviating the pressure on stainless. While NPI production is expected to surge in Indonesia (perhaps be curbed in China) it’s the relative restraint of the class 1 nickel producers (Vale, Norilsk, Jinchuan etc) which is providing no fundamental response to cap the LME nickel rally.
Still, we expect the rally to taper. Nickel has been fairly resistant to the trade war tensions given its longer-term bullish electric vehicle (EV) narrative but it's not immune. Prices are down 12% since the G7 meeting. We also stick to our view that there is no fundamental reason for exchange stocks to draw more this year (but likewise nothing stopping traders doing so) and if that tapers off, the speculators may lack a willing data point.
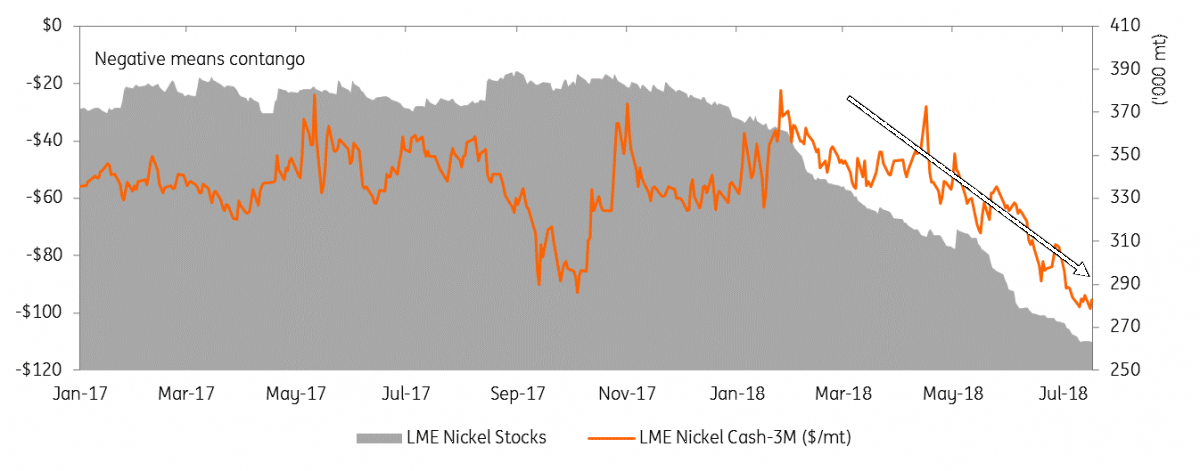
Mostly though, we are watching the ever-widening contango. Even for nickel, the move in the cash-3M spread from $50 in April to nearly $100 in July is extreme. On the one hand, this supports those traders looking to finance stockpiles, but amid a wobbly macro backdrop, it's now also eating into returns of the longs. That wide curve structure, along with flat premiums (Shanghai CIF has been around $150 and down from $300 at the beginning of the year), gives us the conviction that nickel has been gaining on speculative flows rather than the current physical trends. Key to remember is that EV is currently only c.5% of demand. We are long-term bulls but suspect things will slow down for a while.
Nickel Background:
What tightness? LME Nickel stocks draw but the contango gets wider
Iron Ore: Grade is King
We have become progressively more bullish on iron ore this year as China’s preference for high-quality ores provides support for benchmark 62% and higher grades. Meanwhile, supply disruptions have significantly cut the expected seaborne surplus.
We think iron ore’s (via steel) high dependency on Chinese real estate should actually make it more resistant to the trade war tensions (real estate is c.35% of Chinese steel demand) than those metals more heavily used in manufacturing and exports. Chinese new housing starts are surging, up 12% YoY as property investment (9.7% YoY) remains the main pillar of fixed asset investment and indeed is expected to get central support in order to maintain China's growth expectations through any trade hit.
With a degree of trade war immunity, we expect the main driver of iron ore prices to be the increasingly stringent environmental curbs to steel production. Such curbs boost utilisation rates and profitability at the un-curbed capacity and provide both the purchasing power and economic incentive for higher grading, higher yielding ores.
Restrictions on steel production (+sintering/coking coal) have been extended outside the winter heating seasons, supporting higher-for-longer mill profits/iron ore grade premiums but are expected to intensify during the key November-March months when we also upgrade our price forecast for the 62% Fe price to average $66 for 4Q and $65 for 1Q. While that's up from current levels, it would still be down on last year (even with wider-than-expected steel winter cuts) since we see more of the volatility in grade premium transitioning to those above 62% Fe.
Key to watch will be the implementation of stricter policies, particularly in the largest hub Tangshan (c.11% of Chinese steel production) and the focus centre for most of the sporadic cuts to sintering (pre-treatment of fines). Here, 10-15% cuts outside of the heating season have now been notched up to 50% for some mills in the next six weeks at least. Before October, steel, coke and coal power sectors have to meet new ultra low emissions targets or face closure.
Iron Ore Background:
Iron Ore grade premium follows China's steel mill profitability
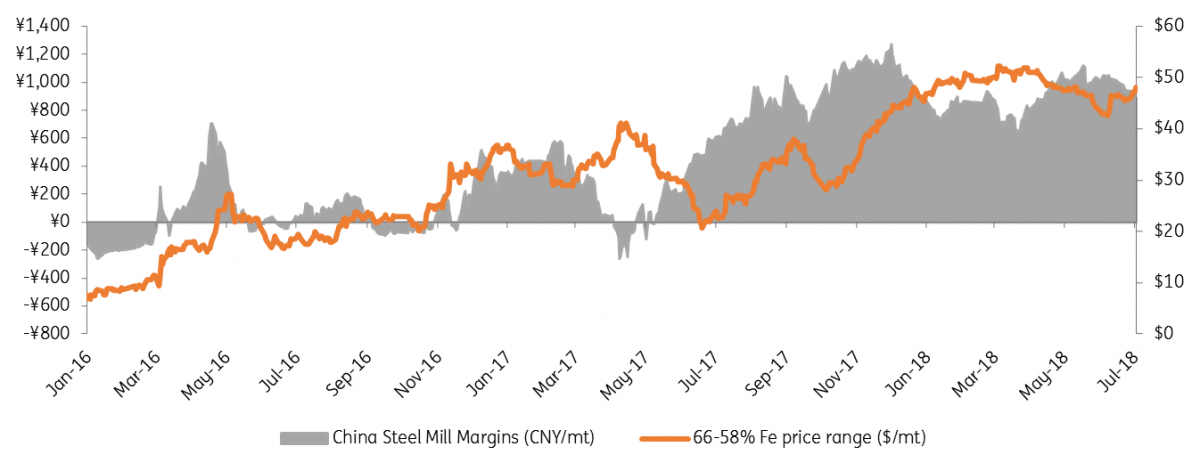
But the premium is shifting to grades above 62%

Content Disclaimer
This publication has been prepared by ING solely for information purposes irrespective of a particular user's means, financial situation or investment objectives. The information does not constitute investment recommendation, and nor is it investment, legal or tax advice or an offer or solicitation to purchase or sell any financial instrument.Read more
Included in the following bundle
In Case You Missed It: Nothing thrilling
- This bundle contains 6 Articles