European power markets ease but prices remain high
European power prices are benefiting from an uptake in power demand, strong commodities markets and the ‘Fit for 55 strategy’ by the European Commission, which supports carbon prices. Electricity prices will remain elevated in the short term, but are likely to come down a bit amid limited upside for the gas, oil and coal markets
European utilities gain from surging power prices
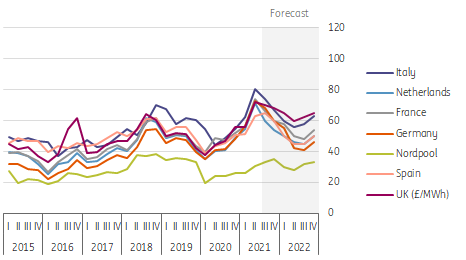
Power prices have recovered strongly from the Covid-19 induced dip. At the end of 2Q21, for example, the UK electricity 1-year forward contract was at £72.08/MWh, a level not seen since 2008. As a result, European utilities, especially those largely exposed to power merchant activities, will enjoy a strong recovery in 2021 and 2022. The robust recovery in power prices seen in the first half of 2021 will be a major positive for the sector by the end of this year and even more importantly, from 2022 onwards.
Power prices have recovered from the Covid-19 dip and remain at elevated levels
One year future baseload power price in euro per MWh for European countries and pound sterling per MWh for the UK

The increase in power prices is the result of multiple factors
- A strong recovery in power demand following the reopening of the economy.
- Rising commodity prices (both gas, oil, coal and carbon prices).
- Adverse weather conditions for renewables and nuclear power plant outages in certain countries with the UK as the primary example.
We will analyse the impact of power demand and commodity prices on power prices in the rest of this article, leaving aside the weather conditions and power plant outages, as these are hard to predict.
Electricity demand recovers from Covid-19 lows
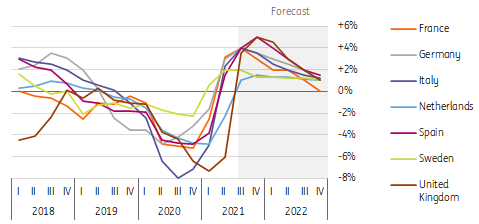
The rollout of vaccination plans and reopening of shops and services in the first six months of 2021 boosted demand for electricity, especially in countries that were most hit by social restrictions in 2020. On a 12-month basis, France’s power consumption at the end of June 2021 came in 3.2% stronger than a year ago. Italy and Spain, respectively, registered 2.4% and 1.5% growth.
| 3% |
Germany and France's power demand was up 3% year-on-year in June |
Despite somewhat disappointing numbers in April and May for industrial production, Germany’s electricity demand bounced back remarkably as well, with a 3% increase. The UK and the Netherlands reported negative growth in the second quarter, but growth is likely to turn positive again in the third quarter.
Power demand is back in growth territory
Year-on-year growth in electricity demand, four quarter moving average

EU 'Fit for 55' strategy increases the cost of carbon
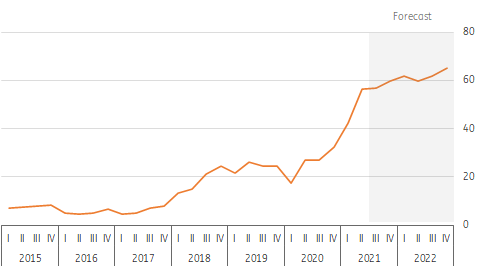
The Emissions Trading System (ETS) is one of the main carbon tax tools put in place in Europe to reduce greenhouse gas emissions. The European ETS price settled at €56.3/CO2 tonne at the end of June 2021. This price has never before been reached in the history of the emissions trading system put in place in 2005.
EU ETS carbon price sets new record in anticipation of increased EU climate ambition
Carbon price in EU ETS scheme in euro per tonne

In the first six months of 2021 the market surged in the run up to the UK ETS system, with emitters in the UK buying carbon allowances in the EU market. The market also anticipated an increase in the EU emissions reduction target for 2030. On 14 July, the European Commission raised the net emissions reduction target from 40% to 55% by 2030 compared to 1990 levels. The ‘Fit for 55’ presents some major changes to the EU ETS to reach the higher target (see box).
| €56/t |
Carbon prices reached a record high at the end of June |
Main changes to the EU ETS from the 'Fit for 55' strategy
- The overall emissions reduction target has been increased to 55% compared to 1990 levels. This creates a reduction target for the EU ETS of 61% compared to 2005 levels (the year the ETS started).
- The linear reduction factor has increased from 2.2% currently to 4.2% annually, probably in 2023 or 2024. The cap will also get a one-off rebase. The size of the rebase will depend on the year that the Directive enters into force.
- A gradual reduction of free allowances, which will be completely phased out by 2036.
- Extension of the Market Stability Reserve (MSR) to aviation, which is not currently impacted by the MSR. There will also be a ‘buffer intake’ which makes the MSR more dynamic in its response to over- and undersupply.
- Extension of the ETS coverage to transportation and buildings, although this is likely to be a parallel system not impacting the carbon price for manufacturing and power generation.
We expect carbon prices to stay at elevated levels up to 2022. Most of the changes have already been factored in by the market. Research from Aurora and PBL shows that there is ample abatement technology available to meet most of the carbon reduction up to 2030 at carbon prices of around 60-70 euro per tonne CO2, so upside potential is limited. We do expect sustained volatility in carbon prices as traders are still figuring out the interplay of the EU ETS with the UK ETS and the political uncertainty surrounding this, as the Fit for 55 strategy goes through Parliament.
Either way, elevated and volatile carbon prices will drastically reduce the utility sector’s dependence on fossil fuel sources to generate electricity. Higher carbon prices are also reflected in power prices as power generators can fully or partially pass them on to the final consumer.
Power prices remain elevated
Surging power demand and buoyant commodity markets suggest that baseload power prices will remain high, with an atypical seasonal pattern for 2021. Lower gas, oil and coal prices should put downward pressure on power prices in 2022, but this is mitigated to some extend by rising carbon prices. It is back to normal again for 2022, with summer prices expected to be lower compared to winter prices. Note that, as always, actual price levels will depend on how cold winters will be and if summers will be plagued by heatwaves. Increased growth in renewables is likely to weigh on the power prices that renewable energy assets capture from the market. All in all, European utilities are expected to profit from strong power markets.
ING power price forecasts
Euro/MWh for European countries and Pound/MWh for the United Kingdom

Unseasonal strength for gas
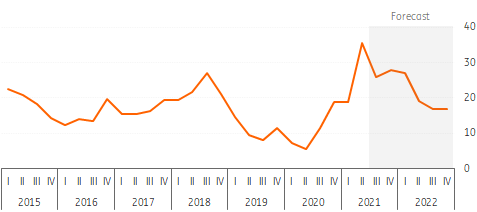
Most of the time, gas-fired power plants are the price setting technology in European power markets, so changes in gas prices are extremely relevant for power prices. European natural gas prices have seen significant strength so far this year, with TTF rallying by more than 75% over the first six months of the year and hitting record levels. This is an unseasonal pattern for gas, as prices are normally higher in the fourth and first quarter.
Gas prices hit record levels but are expected to ease
Day ahead forward gas price in Euro per MWh on TTF exchange, quarterly data (price on last day of the quarter)

There have been several drivers behind the strength of the gas market in the first part of the year.
Firstly, injection season in Europe had a late start because of colder than usual weather in April, and while we have seen the pace of injections picking up more recently, gas inventories in Europe still remain at a five-year low and around 22% below the five-year average.
Secondly, the strength in carbon prices has been bullish for natural gas; carbon prices in Europe have rallied by more than 67% in 1H21 and have hit record levels. This has ensured that we continue to see coal to gas switching for power generation.
Furthermore, we have seen some heavy maintenance from Norway in recent months, which would have led to reduced flows to Europe. In addition to this, there is also scheduled maintenance for both the Nord Stream and Yamal-Europe pipeline, which further supports the market. Asia has also seen strong demand this summer, particularly from China. As a result, we are seeing Europe having to compete with Asia for LNG cargoes.
As for next year, much will depend on how cold a winter Europe experiences. However, the supply picture should improve, partly because Nord Stream 2 is expected to start up later this year. This should mean that we do see prices trading lower year on year. We are currently forecasting that TTF averages EUR27/MWh over 2H21, while over full year 2022, we expect prices to average around EUR21/MWh.
ING gas forecasts

Limited upside for oil
Gas prices are still closely linked to changes in oil prices, so oil prices are also important drivers for power prices, despite the fact that oil is not used too much as a fuel to generate power.
The oil market has seen a robust recovery so far this year as it rebalances. ICE Brent rallied around 47% over the first six months of the year and has managed to briefly trade above US$77/bbl, levels last seen in 2018. The pace at which the market has managed to draw down excess inventories has been remarkable due to unprecedented supply cuts from OPEC+. OECD oil inventories are now back below the 2015-19 average, having been almost 260MMbbls above this five-year average back in July last year.
The demand recovery has also helped to draw down excess inventories. After falling by around 9MMbbls/d in 2020, global oil demand is set to grow by 5.4MMbbls/d in 2021, still leaving it below pre-pandemic levels. However, the recovery in demand is set to be more robust over 2H21 as we see vaccination rates pick up around the world, and we are forecasting that we finish 2021 with demand back at around 97% of pre-pandemic levels. As for 2022, demand is expected to continue to recover, growing by around 3MMbbls/d, and by the end of next year, demand is expected to be back at pre-Covid-19 levels.
| $70/bbl |
ICE Brent will average US$70/bbl over 2022 |
We continue to believe that the amount of spare capacity that OPEC+ is sitting on should ensure that oil prices do not move higher for a sustained period. We expect that 2022 will see sizeable non-OPEC supply growth and are currently forecasting that it will grow by 1.75MMbbls/d YoY. This growth will largely come from the US, where the higher price environment should see drilling activity pick up.
The growth of non-OPEC supply, along with easing OPEC+ supply cuts should ensure that the market is closer to balance next year, and as a result we are currently forecasting that ICE Brent will average US$70/bbl over 2022.
ING oil forecasts
US$/bbl

Coal prices set to weaken
Coal is still a major energy source in some European power systems, with Poland and Germany being a case in point.
Coal prices have not been left behind by the surge in energy prices. European coal prices have rallied a little more than 74% in 1H21 and have traded above $130/t recently. Having seen global coal demand falling by an estimated 4% in 2020, the IEA is forecasting that global coal demand will grow by 4.5% in 2021, taking demand back to pre-Covid-19 levels.
In Europe, a tight gas market has proved bullish for coal. However, there are also supply dynamics which have tightened the coal market such as disruptions in Colombia, a key coal exporter to Europe. China has played a key role in the strength of the market, with strong restocking demand for the summer helping to tighten the market. Nevertheless, one cannot rule out changes to government policy which could have a large impact on the seaborne market.
However, we are of the view that European coal prices should trend lower as we see supply/demand dynamics improve. We expect to see an improvement in supply from Colombia, while in the longer run, it is clear that the outlook for coal demand is weak, particularly for Europe, with policy continuing to drive it out of the energy mix.
ING Coal forecasts
US$/ton

This publication has been prepared by ING solely for information purposes irrespective of a particular user's means, financial situation or investment objectives. The information does not constitute investment recommendation, and nor is it investment, legal or tax advice or an offer or solicitation to purchase or sell any financial instrument. Read more
Download
Download article
27 July 2021
When doves cry This bundle contains 6 Articles


