EUR/USD: Not as cheap as it looks
- 16 March 2022
- FX
While EUR/USD near 1.10 looks historically cheap, our Behavioural Equilibrium Exchange Rate model actually suggests that EUR/USD is at least 9% overvalued in real terms. This is primarily due to a significant deterioration in the eurozone’s terms of trade induced by high energy prices


BEER model suggests medium-term overvaluation
The recent rise in energy prices on the back of geopolitical developments in Ukraine have taken a toll on the euro and other countries that rely heavily on importing energy commodities, especially from Russia. The market consensus is that EUR/USD is currently cheap as it already embeds a degree of geopolitical risk and significant Fed-ECB policy divergence. Yet a look at one medium-term valuation metric suggests a rethink on what is the equilibrium value for the pair.
Our Behavioural Equilibrium Exchange Rate (or BEER) model aims at identifying medium-term real mis-valuation in FX rates using productivity, terms of trade (export prices divided by import prices), government consumption and current account data as explanatory variables. All data are from the OECD and have quarterly frequency, which means that our model identifies a fair value for EUR/USD as of 4Q21. The model includes data from 1999 and has an r-squared of 0.71.

In the chart above, we show the historical real mis-valuation of EUR/USD to its BEER fair value, which tends to oscillate around zero within a +/- 10.6% (1.5 standard-deviation band) and in most instances corrected quite rapidly when reaching very expensive/cheap territory. This means that the model tends to provide a rather accurate contrarian signal when the pair reaches or breaches the limits of its 1.5 std. deviation band. This happened in multiple occasions between 2008 and 2014 (overvaluation), and more recently in 2016 and 2020 (undervaluation).
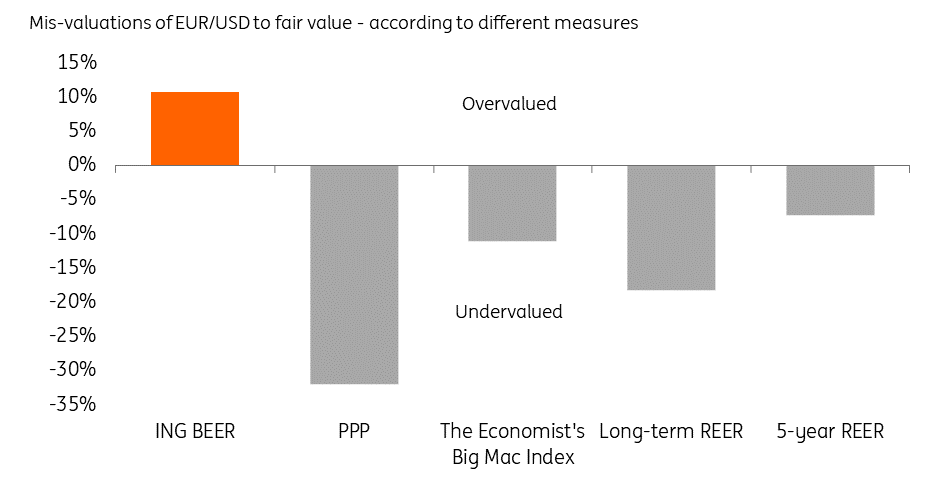
According to this model, EUR/USD is around 9-10% overvalued in real terms, which suggests the current medium-term fair value for the pair could be close to parity.
Terms of trade has driven fair value lower
As shown in the chart below, EUR/USD BEER fair value has declined meaningfully since 4Q20. This has been mostly due to a deterioration in the eurozone’s terms of trade relative to the US, which has historically been the most significant variable driving EUR/USD fair value. Productivity, instead, has been a rather stable factor, and only registered a shock in 1H20 as the pandemic hit, while the current account and government consumption have on average had a very contained impact on the EUR/USD fair value.

Oil and energy prices are surely the most important driver of the EZ-US terms of trade differential. Two dynamics have contributed to the significant drop in this differential: the record-high energy prices and the increased energy independence of the US. As shown in the chart below, the eurozone’s high dependence on oil imports means that the region’s terms of trade is strictly a function of oil prices – also as a benchmark of other energy prices (i.e. gas).
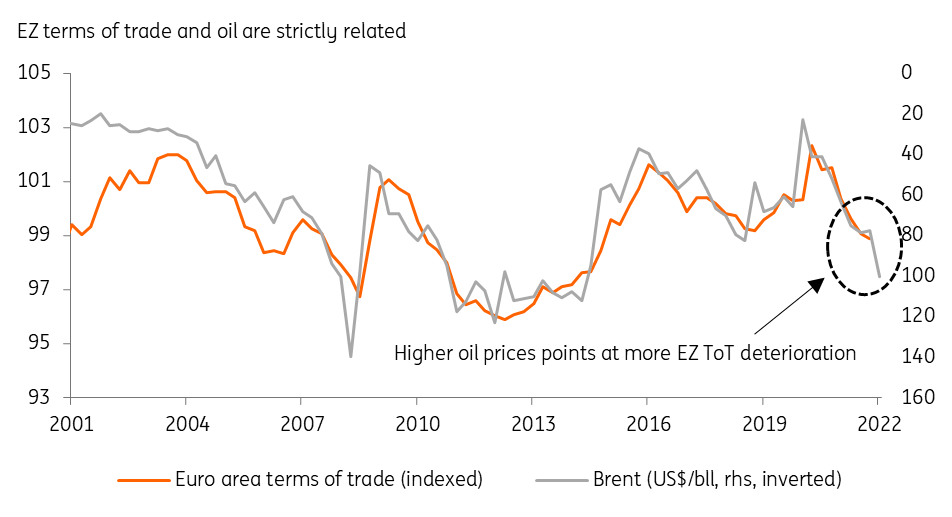
It must be noted that the terms of trade time series (chart above) has a quarterly frequency – the latest value is 4Q21 – while the oil prices series is updated to the current market value. It shows how the current EZ terms of trade has surely continued to deteriorate since the end of last year, which has likely caused a further decline in the real EUR/USD fair value.
The balance between temporary and permanent
The purpose of our analysis is not to conclude that we expect a move in EUR/USD to the parity area: we instead expect the pair to stabilise in the 1.12-1.13 region by the end of 2022 as the ECB starts outlining its tightening cycle. We aim, instead, at signalling how any EUR/USD appreciation will bring the pair close to levels of stretched overvaluation compared to its fundamentals (as estimated in our BEER model).
This notion is in contrast with some commonly used measures of long-term FX valuation – like the PPP, the Big Mac Index, or REER convergence – which all point at EUR/USD undervaluation. However, these other approaches have less solid statistical basis, and we can see multiple examples of currencies structurally diverging from those fair values.
As discussed above, it boils down to the terms of trade (ToT) to drive the EUR/USD fair value at the moment, and the rise in energy prices has been the primary cause of the EZ ToT deterioration. Indeed, the current EUR/USD deviation from its BEER fair value embeds widespread market expectations that energy prices will ultimately abate in the medium term.
However, the conflict in Ukraine has radically changed the scenario for energy commodities, and structurally higher energy prices may be the longer-term legacy of this period of high geopolitical turmoil. We stress once again that the BEER fair value we calculated is based on the terms of trade (and energy prices) as of 4Q21, which was less negative for the pair than it is now.
In other words, any views about a material recovery in the EUR/USD fair value need to go hand-in-hand with the assumption that energy prices will return not just to pre-conflict levels, but to 1H21 levels. Unless this happens, any EUR/USD strength from now on will have to rely on rate differentials above economic fundamentals, and will bring the pair well into expensive territory against our BEER fair value. In short, EUR/USD may not be as cheap as it looks.
Content Disclaimer
This publication has been prepared by ING solely for information purposes irrespective of a particular user's means, financial situation or investment objectives. The information does not constitute investment recommendation, and nor is it investment, legal or tax advice or an offer or solicitation to purchase or sell any financial instrument.Read more