EM portfolio flows: Who’s at risk?
- 13 August 2018
- FX Rates Turkey
Global emerging market assets have come under pressure as investors gauge the next move in Turkey. Should events lead to more indiscriminate selling of EM assets, those countries that had attracted the lion’s share of recent portfolio flows could be the ones to suffer outflows. The big EM proxies of Poland and Mexico could be at risk in this case.


EM investors scale back positions
Global investors have typically been happy to own Emerging Market risk over recent years, although the escalation in trade wars and the dollar rally from early Spring this year has asked some serious questions. That said we are far from seeing a wholesale exodus from emerging markets. Looking at one sub-set of flows – flows in EM local currency debt funds - the retreat has been relatively mild compared to the strong inflows seen through 2016-2017.
An insight into flows into this segment can be gleaned from two popular Exchange Traded Funds (ETFs) that track the JP Morgan EM Local Currency bond index. These ETFs have seen outflows since April this year, but the move looks relatively modest so far. The membership break-down of these ETFs shows Turkey as having one of the smaller EM weightings at 4.0% and 2.4% respectively. This compares to the ‘big beasts’ of the EM debt indices such as Brazil, Mexico, Indonesia, Poland and South Africa, which all tend to have weightings closer to 9-10% in these benchmark indices.

A broader look at EM portfolio flows
Looking beyond the narrow sector of EM local currency debt, the Institute of International Finance in Washington produces timely data on non-resident equity and debt inflows into particular emerging market countries. Their data proxies the Balance of Payment release in each country, which typically would appear with a large lag.
Using data from the IIF, the chart below provides a relative snap-shot of where non-resident portfolio (debt and equity combined) was parked in EM at the end of July. For example, the data suggests that investors had relatively light positions in Malaysia and Hungary, while positions in India, Korea, Mexico and Poland were quite high relative to where they had been over the last three and a half years.
We’ve removed China from this chart since cumulative inflows of over US$250bn since 2015 (Chinese asset markets becoming more integrated) eclipse all the other EM flows.
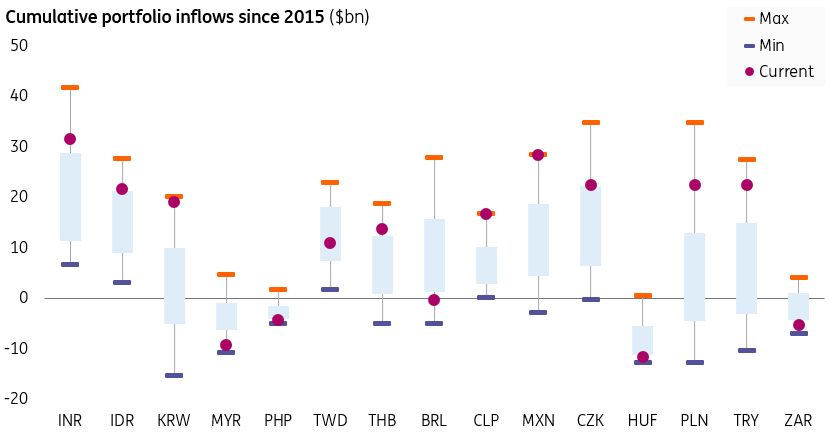
Who’s at risk?
While the largest inflows have gone to China, we suspect that Chinese policymakers have the tools to prevent large-scale portfolio outflows. Should USD/CNY look to approach 7.00, the PBOC could once again trigger the ‘counter-cyclical factor’ in the daily fixings – effectively a manual over-ride to keep the fixings steady.
The implications from the above, as Viraj Patel points out in a recent article, is that it could limit a further sell-off in Asia FX.
Instead, were the Turkish sell-off to broaden substantially, those countries (and currencies) most exposed to portfolio outflows could be the likes of Poland and the Czech Republic in EMEA – and Mexico and Chile in Latin America.
Gustavo Rangel has just published a positive piece on Mexico based on the domestic political programme, but our point in this article is to highlight who’s at risk should indiscriminate EM selling emerge and even good stories are ignored.
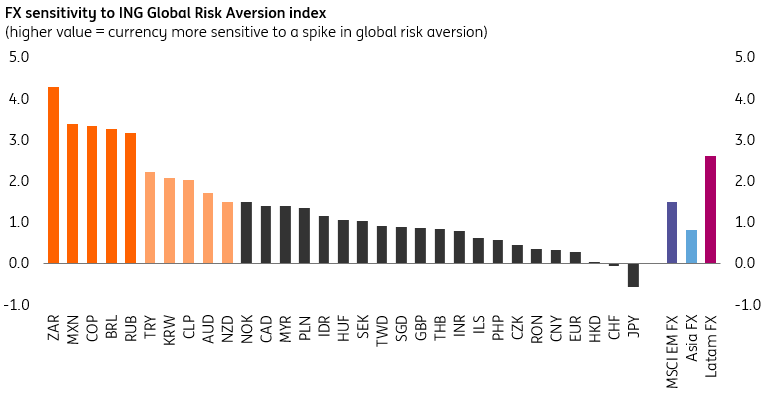
A year of global risk aversion? More like sharp, one-off unsustained spikes
Although the Turkey-related global market sell-off has registered a spike in our Global Risk Aversion index similar to episodes such as the 2013 Fed 'taper tantrum', we note that such sell-off episodes in 2018 have not been sustained (the overall Global Risk Aversion index is still at historically low levels).
Those currencies most sensitive are the usual high-beta suspects like the South African rand (ZAR) and Mexican peso (MXN) - and while these currencies suffer on days when global risk aversion spikes, they also typically rebound quite sharply on any short-term reprieve in global risk sentiment. This is worth bearing in mind given the ever-changing geopolitical backdrop.

Content Disclaimer
This publication has been prepared by ING solely for information purposes irrespective of a particular user's means, financial situation or investment objectives. The information does not constitute investment recommendation, and nor is it investment, legal or tax advice or an offer or solicitation to purchase or sell any financial instrument.Read more
Authors


Included in the following bundle
In case you missed it: The contagion effect
- This bundle contains 8 Articles