Deconstructing the Australian construction industry
- 21 June 2022
- Manufacturing, Construction and Retail Australia
Shrinking as a proportion of total GDP and with little overlap with the broader economy, we dissect the construction industry and assess its future

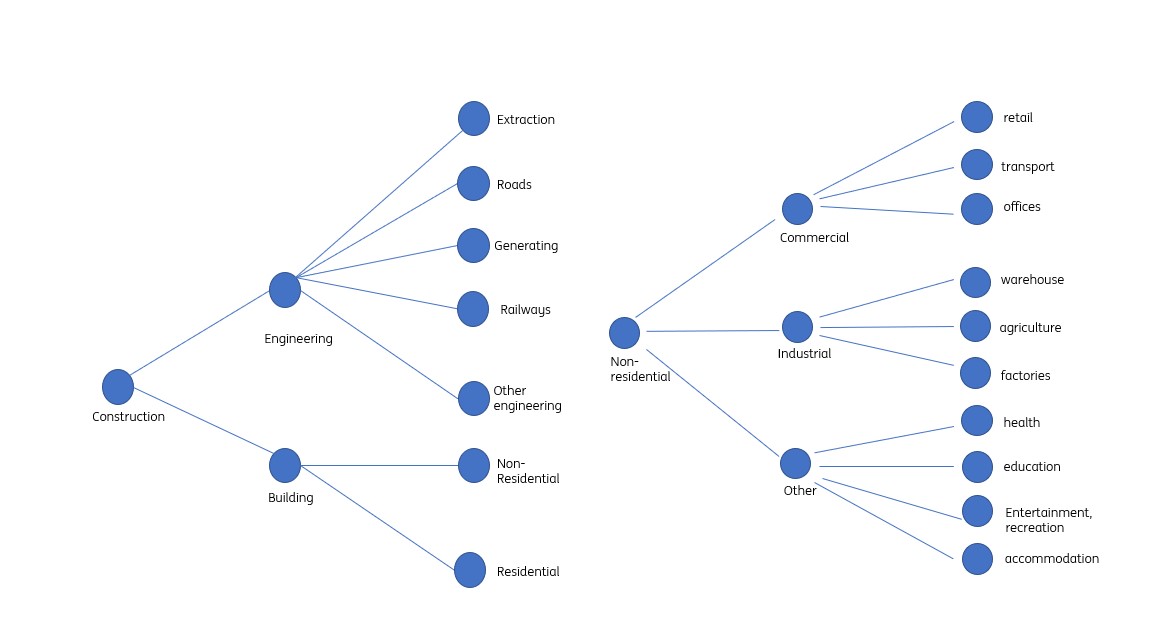
A breakdown of the Australian construction industry
Construction and GDP are distant cousins
When Australia's economy was hit by Covid-19 for the first time in the first quarter of 2020, it marked the first contraction of the economy in 35 quarters and a record that is hard to beat among developed economies. The previous contraction came in the first quarter of 2011, a brief and shallow interlude that was all that marked the financial crisis for Australia.
The construction industry has not been so resilient. The chart above shows instances where combined construction (dwelling and non-dwelling) exhibited a quarterly contraction (in grey) and overlays that on quarters where this coincided with a contraction in GDP.
It's not hard to see that there isn't much overlap. And so while there have been historical occasions when Australia's broader economic trends and the construction industry overlapped, for the most part there doesn't seem to be a huge amount of correlation, or probably much causation.
But with the Reserve Bank of Australia (RBA) now embarking on a tightening spree, and with costs rising, this might be one of those rare moments where the broad macro and construction fates overlap to a degree. In what follows, we dissect the industry along residential and non-residential axes and then split the non-residential sector further along its engineering and building subcomponents.
Quarterly contractions in combined construction and GDP

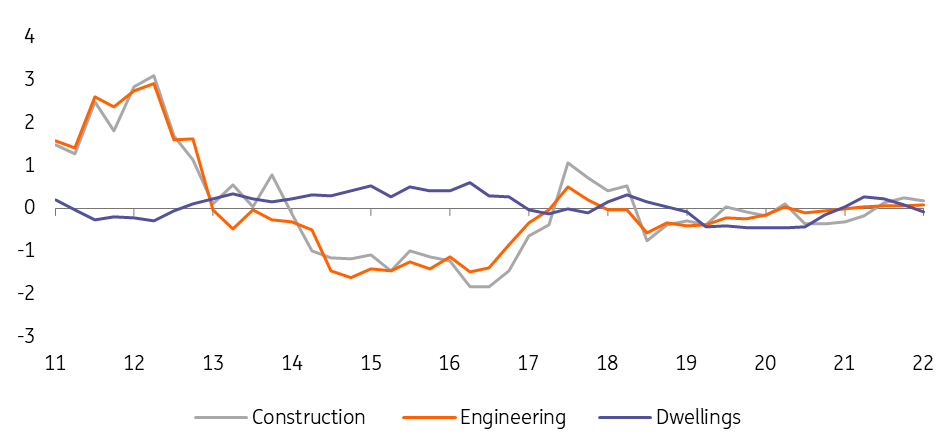
Construction hasn't meaningfully contributed to GDP in years
Accounting for about 10.5% of real GDP over the last four quarters, construction is a far smaller element of Australian GDP than it has been in the past. In 2013, for example, Australian construction accounted for a fifth of total GDP.
This ongoing shrinkage has meant that the construction sector in Australia has not meaningfully contributed to Australian GDP growth since 2018. Though in recent years it has at least avoided the big contractions in the non-dwelling segments seen between 2013 and 2017. These were only partially offset at that time by a more buoyant residential construction market.
Last year saw all segments of the construction sector creep out of contraction, but in no segment does construction look particularly robust at a point in the business cycle where rising rates and higher construction costs look likely to add considerable headwinds.
Construction, contribution to GDP YoY%
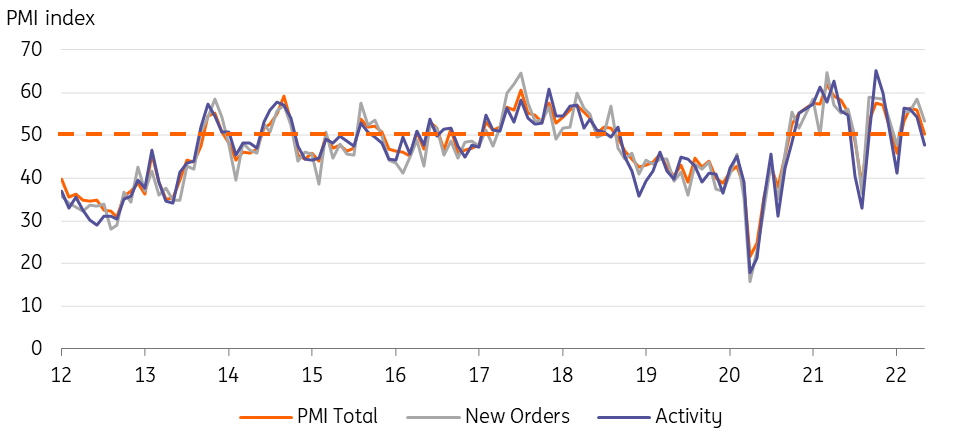
Construction sentiment is down
Construction PMI indices turned abruptly lower in May of this year, following several months of robust growth readings coinciding with the re-opening of the economy post-pandemic. The downturn was equally evident across both activity and new-orders sub-indices. Such occasional swings in sentiment are not uncommon and don’t necessarily imply anything too alarming, although the fact that this has coincided with the RBA’s transition from one of the most dovish central banks in the G-10 to an increasingly hawkish one, means we might not want to dismiss negative signals on construction sentiment too readily.
Construction PMI index
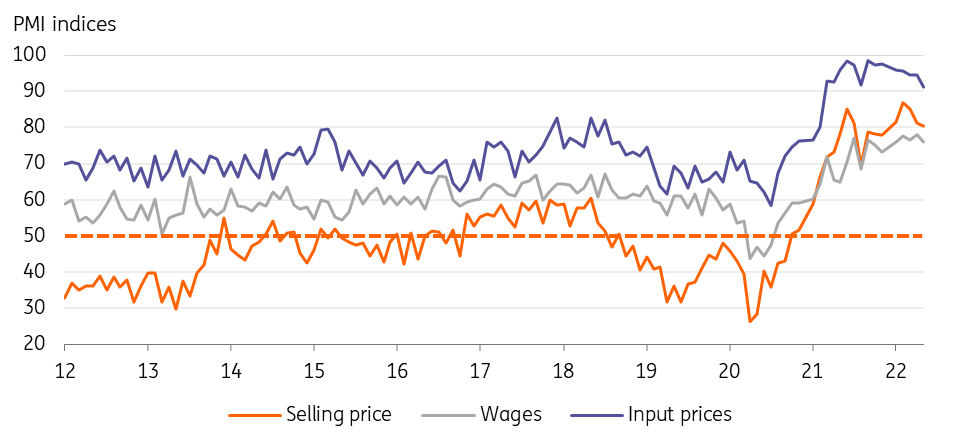
Price pressures are building
The most likely source of the drop in sentiment is the surge in costs within the industry. All input costs, including industry wages, have risen substantially, and while selling prices have also risen, the PMI indices imply that selling prices are rising slower than input costs. That can't be good for margins. Other PMI indices show a familiar pattern in a number of industries right now, rising delivery times and employment shortages.
Costs have surged more then selling prices
Pipeline of work to do is bulging
Another useful set of data to consider reflect how the pipeline of construction activity is shaping up. Construction approvals precede construction starts. Work done in any period determines the rate of construction completed and can give rise to swings in the amount of construction work “yet to be done” – essentially, the pipeline of construction work.
Until the last few months, what we saw from pipeline construction data was a pickup in construction approvals and starts but a slower pace of construction completions. The net result of this was that the value of construction yet to be done had ballooned, although it now appears to be topping out as starts and approvals have both dropped more recently compared to work done. This suggests that construction activity will remain supported over the coming quarters as backlogs are worked through. So the near-term outlook appears positive although a recent dip in approvals and starts could see the pipeline of work to be done start to decline over the coming quarters.
Pipeline measures of construction

Building construction
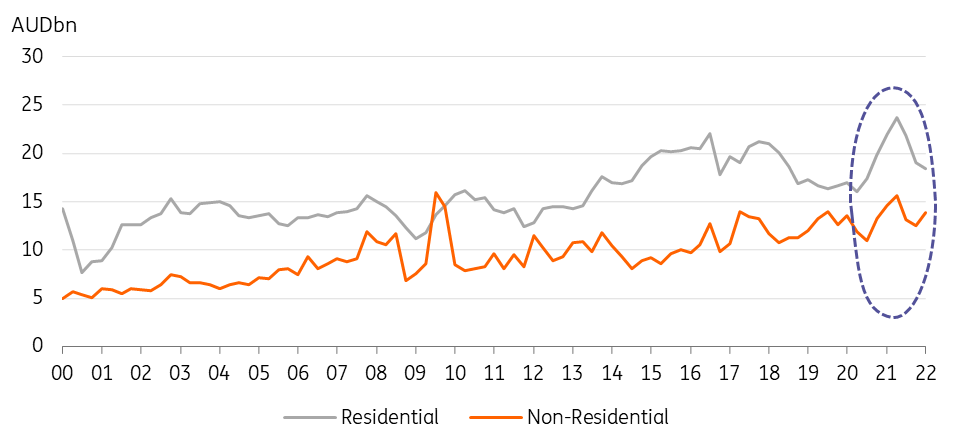
Construction in Australia is broadly split by building and engineering, with building accounting for about 56% of total construction and residential building a similar proportion of total building.
Both residential and non-residential building construction accelerated during the first half of 2021 in response to the re-opening of the Australian economy and earlier pandemic assistance policies. But both types of building have fallen back since then.
Residential building is still proceeding at a faster pace than it was in 2018/19, just prior to the pandemic, but at a slower pace than during 2015-17 when Australia managed to duck the worst of the global financial crisis and continued to enjoy strong growth helped by a low interest-rate environment. The recent dip in building activity seems like a return to a more sustainable trend growth rate after the shocks of the pandemic. Non-residential investment has experienced a much steadier pace of expansion and is holding up a little better than the more cyclical residential activity.
Building construction by type
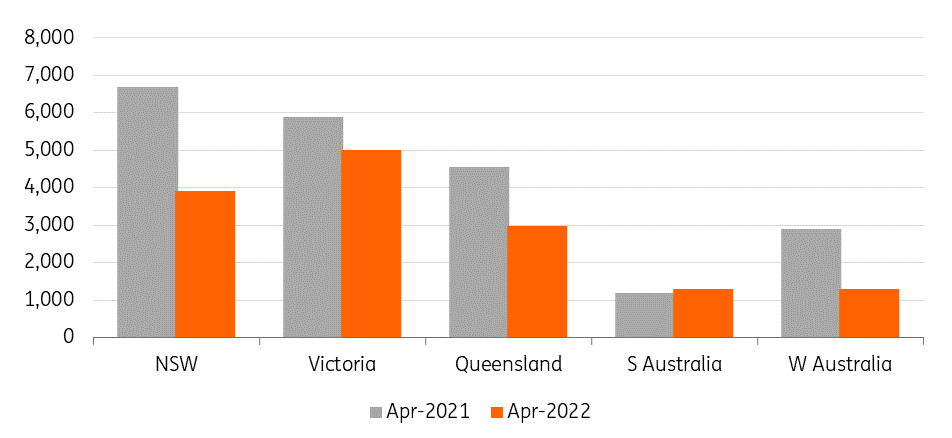
Residential building by state
Residential building construction by state shows the same surge during 2021 as low policy rates and stimulus spending gave the sector a lift. All states apart from South Australia have seen dwelling construction dip back as normal conditions have resumed, but Victoria and Queensland are holding up better than New South Wales.
Residential building by state
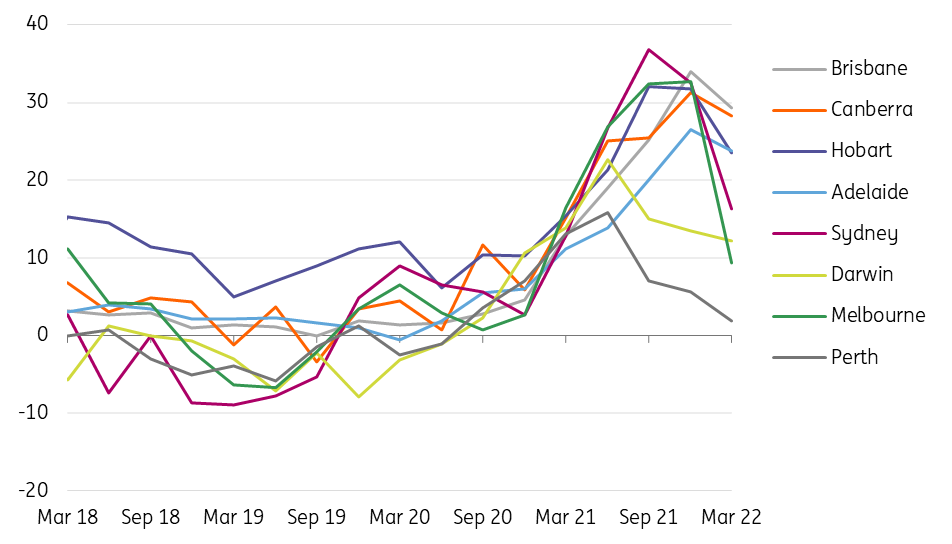
Limited read-across from prices to construction
There is very little overlap between dwelling construction and residential property price growth. Certainly, the sharp decline in median property price growth in Melbourne may also mirror the relatively strong supply of dwellings shown in the previous chart. But there are very few other overlaps. The main takeaway being that in all major cities, residential property price growth peaked in 2021, and has been coming down steadily since then. That could also begin to weigh on the supply side for housing if it continues.
Residential property prices, by major city YoY%
Non-residential construction
Within the non-residential construction sector, it is the “other” category that has grown at a faster rate than commercial or industrial property. The fastest-growing subsectors of this catch-all group are education, followed by health, recreation, and entertainment.
Non-residential building by type of construction
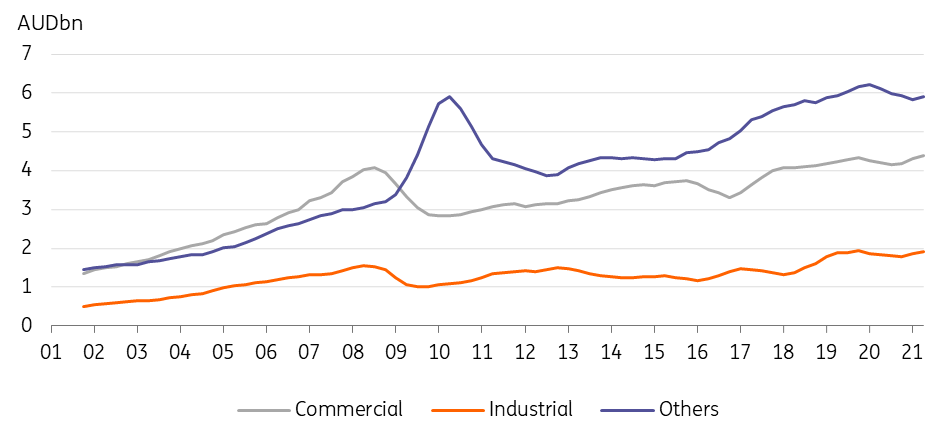
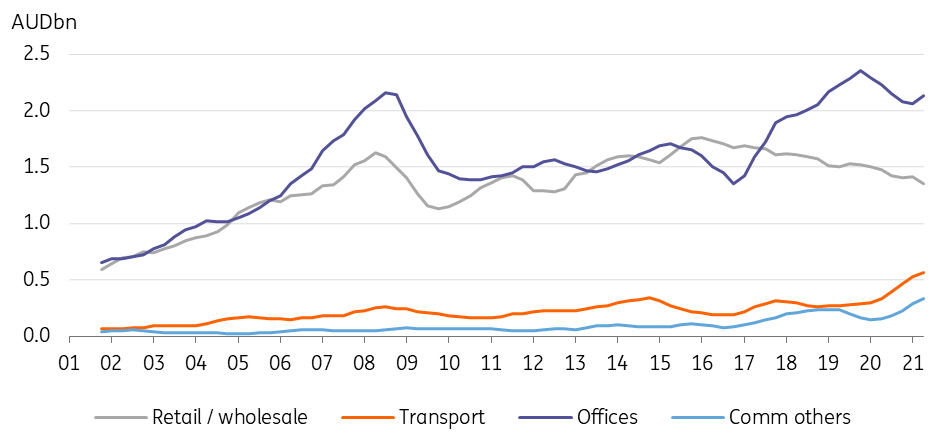
Within the commercial sector, office space is providing the most growth. While for industrial building, warehousing is by far the strongest category.
Non-residential construction – commercial
Engineering is dominated by extraction
Engineering construction refers to the subgroup of buildings that are typically structures, rather than places to live or work or conduct business. They include such things as roads, bridges, mines and harbours.
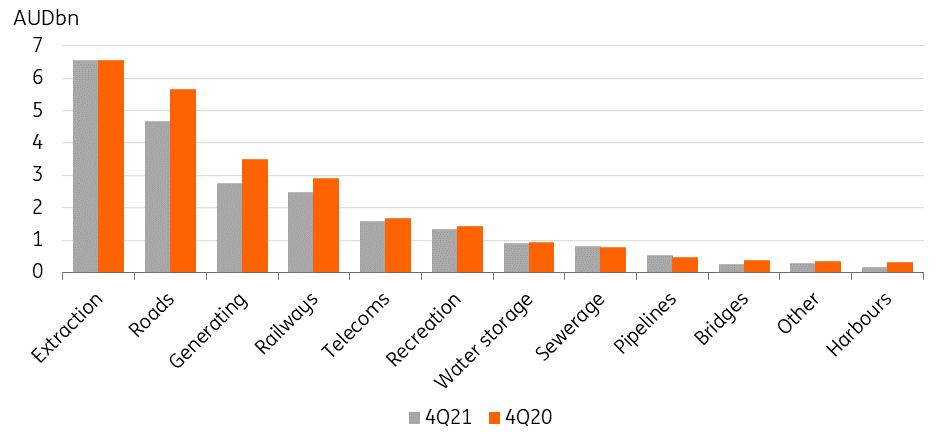
Extraction (mining) accounts for the single largest expenditure in this category, although it is not seeing much growth, remaining more or less flat in 2021 compared to 2020. Other engineering sub-sectors, such as roads, power generation, and railways are providing most of the growth in this sector, possibly helped by pandemic infrastructure spending policies. If so, these may start to ease off in 2022. Power generation construction has been particularly strong. There may be some increased spending on renewables buried within this data.
Engineering by type
Engineering work for the extraction industries usually follows the commodity price. With iron ore and copper prices quite weak currently and gold under pressure as global interest rates rise, this is likely to stay fairly flat or even soften slightly in 2022.
Engineering, major types YoY%

Non-residential construction by state and territory
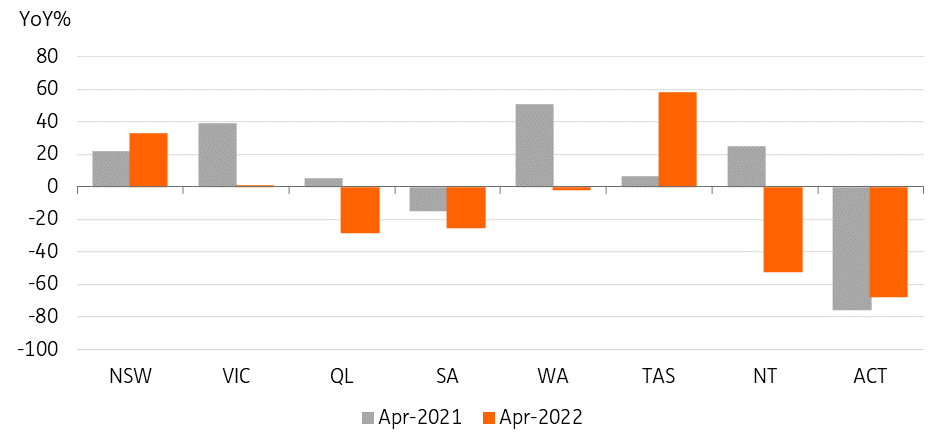
Non-residential construction activity has not been evenly spread across Australia. In terms of growth rates, Tasmania has seen some of the fastest growth in spending, and amongst other things, reflects construction related to renewable energy generating projects, including green hydrogen. Other than Tasmania, New South Wales has also seen non-residential construction spending accelerate, but it has been contracting or stagnating in most other states.
Non-residential construction by state and territory
Outlook: near term looks OK, but further out is less positive
The current macro setting is not a bad one for construction, though on balance we would expect to see a slower pace of construction spending over the next 12-24 months. In the very near term, the pipeline for work yet to be done could provide some support for construction through the end of this year.
But residential spending will at some stage succumb to higher interest rates and growing job insecurity. This seems a way off now as the unemployment rate is at a historical low, but if it doesn’t rise it is difficult to see inflation being tamed. House price inflation is already on its way down, and in all likelihood will continue to soften. In some states, there may even be some decline in median prices.
On the non-residential side, the extraction industries will likely remain subdued by global headwinds and, in particular, the weakness of the Chinese economy. This could change, but visibility on this or the evolution of the war in Ukraine and its impact on commodity prices and in turn extraction activity remain very limited. With financial markets steeling themselves for a possible global recession, anything other than a fairly sombre outlook for this sector would seem inconsistent, though supply issues can’t be ignored.
The incoming labour government may provide a little more government spending to support other non-residential projects over the coming year or two. In particular, there may be more of a boost to renewable energy construction within the engineering sector. But the bigger picture may well be the waning of pipeline projects as pandemic stimulus measures reach their natural course.
Content Disclaimer
This publication has been prepared by ING solely for information purposes irrespective of a particular user's means, financial situation or investment objectives. The information does not constitute investment recommendation, and nor is it investment, legal or tax advice or an offer or solicitation to purchase or sell any financial instrument.Read more