Crude oil: A story of demand
- 16 August 2018
- Commodities daily
Growing trade tensions and increasing emerging market risk have weighed on the commodities complex. The Bloomberg Commodities index has fallen by almost 3% since early August and more than 9% since late May. Oil has been unable to escape this selling pressure, with ICE Brent having fallen close to 10% since late May


Downside risk to oil demand
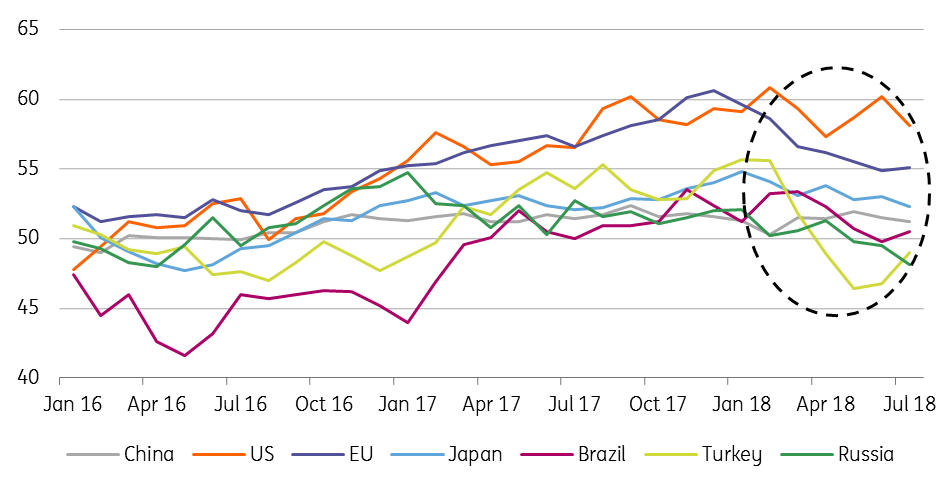
It does seem that the synchronised global growth story from earlier this year is losing some momentum. Yes, the US economy is still growing strongly, but with the US Treasury yield curve moving ever closer to inversion, there is concern that this could be a precursor to a slowdown. Meanwhile, trade tensions do not seem as though they will be resolved anytime soon, which will do little to help growth. Already if we look around the globe in recent months, manufacturing PMIs have softened in a number of countries although they still point towards expansion. Adding to this is the potential risk of contagion from the current Turkey crisis. Other emerging markets have already been hit, evident through depreciating currencies, investors demanding higher yields on emerging market debt and a jump in credit default swaps on this debt. However saying all of this, the US Federal Reserve seems unlikely to deviate from its plan for tighter monetary policy, which should remain supportive for the US dollar, whilst growing emerging market risk adds further support to the currency.
So what does this all mean for oil? A number of agencies have highlighted the downside risk to current demand growth forecasts. At the moment the IEA estimates that global oil demand will grow by 1.4MMbbls/d over 2018, compared to growth of 1.52Mmbbls/d in 2017. For 2019, it estimates demand growth will increase slightly to 1.5MMbbls/d. However, the agency has stressed that there is potential downside risk as a result of growing trade tensions and the stronger oil price environment; remember ICE Brent is up almost 58% since the lows of June 2017. Given concerns over emerging markets, this risk is likely even more real now. OPEC also downgraded its demand growth forecasts for 2018 and 2019 in its latest monthly report.
Manufacturing PMI edging lower in a number of countries
Rising USD and stronger oil prices
Recent developments in Turkey have highlighted a dynamic that has been at play for some time now in the oil market- a strengthening USD along with stronger oil prices. More constructive oil fundamentals had meant that the usual inverse relationship between the two broke down somewhat, calling into question those with more bullish demand growth forecasts. Although more recently, the inverse relationship has started to re-emerge once again.
The USD index has appreciated by almost 5% since the start of the year, with the Turkish lira and Argentine peso the worst performers, down over 40% year-to-date against the USD, the Brazilian real is down almost 17%, the South African rand down 12% YTD, whilst the Indian rupee has depreciated by 8.6% over the same time period. This has meant that the 7% YTD rally we have seen in ICE Brent looks far stronger in domestic currency terms. For example, oil prices in Turkish lira have rallied almost 74% so far this year, and 160% since the lows of June 2017.
ICE Brent and USD Index 90 day rolling correlation

ICE Brent YTD oil price movement in local currency (%)

So what does this mean for oil demand?
The impact on oil demand is largely dependent on how governments react. Will higher costs be borne by consumers or will governments try to shield consumers as much as possible from rising fuel prices through subsidies?
Already we have seen a number of countries reintroduce/increase subsidies. Earlier this year, we saw truck drivers in Brazil go on strike over increasing diesel prices, the strike only came to an end when Petrobras agreed to reduce prices by 10%, and instead of daily price changes, prices will be reviewed every 30 days. Politics were clearly at play here as well, with Brazil set for general elections later this year.
In Malaysia, the government announced that it would fix certain fuel prices through the end of 2018, which would equate to a cost of around $760 million for the government. While in Indonesia, the government announced energy subsidies totalling $4.8 billion, in order to keep fuel prices unchanged for the remainder of the year. Subsidising fuel prices obviously creates another issue for a number of emerging markets- it makes it more difficult to hit their fiscal targets.
A good example of a country torn between wanting to keep consumers happy and trying to balance the books is Argentina. The government has tried to liberalise the market, through scrapping fixed domestic crude oil prices and reducing subsidies. This was done in the hope that it would attract investment in the domestic oil industry, whilst also reducing its fiscal deficit. Once lifted, domestic oil prices rallied along with the move in international benchmarks, which also meant consumers were paying higher pump prices. Under pressure, the government intervened earlier this year, fixing domestic crude oil prices for a couple of months, while also coming to an agreement with fuel distributors to limit pump price increases.
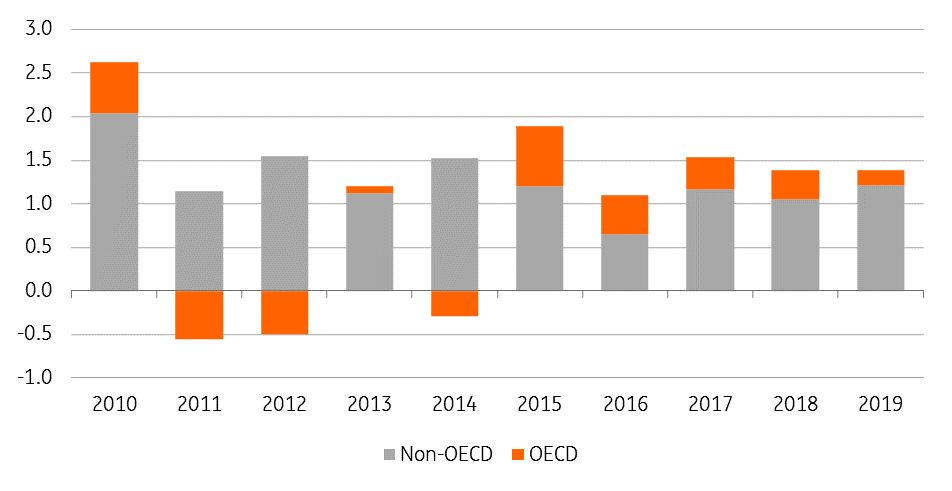
Looking at individual cases suggests the potential impact on demand growth is limited, however when looked at in aggregate, the potential impact does start to look more significant. Global oil demand growth is predominantly driven by non-OECD countries, 88% of global oil demand growth in 2019 is expected to come from non-OECD countries, and so the potential impact from an emerging market crisis could be fairly significant for oil demand growth expectations. It is also worth pointing out that a little over 50% of this non-OECD demand growth comes from just China and India. Our current balance is assuming that the global oil market will be largely balanced over 4Q, and so any slowdown in demand will only push the market deeper into surplus. The big assumption around this though, is that supply losses from Iran do not exceed 500Mbbls/d in 4Q18 as a result of US sanctions, and that Venezuelan output averages 1.2MMbbls/d over the last quarter.
OECD and non-OECD oil demand growth (MMbbls/d)
Brazil is already seeing demand destruction
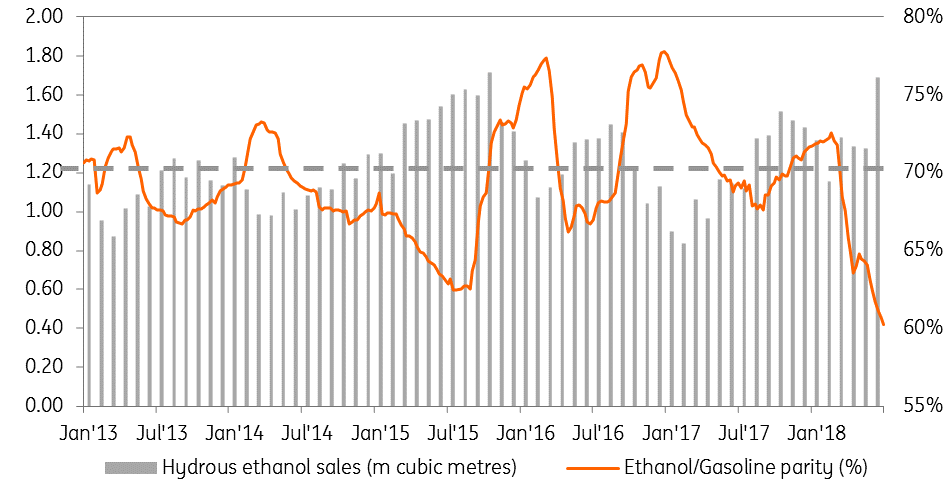
It is interesting to have a look at the impact higher oil prices are having on gasoline demand in Brazil. The reason being that the bulk of motorists have an alternative fuel option. More than 50% of the light vehicle fleet in Brazil is made up of flex fuel vehicles- those that can be run on gasoline or 100% ethanol. Motorists generally act in a rational manner, and should start switching to ethanol when it becomes cheaper than gasoline. The rule of thumb is that energy parity between gasoline and ethanol is 70%, and so when ethanol prices are less than 70% of gasoline prices we should start seeing the switch over.
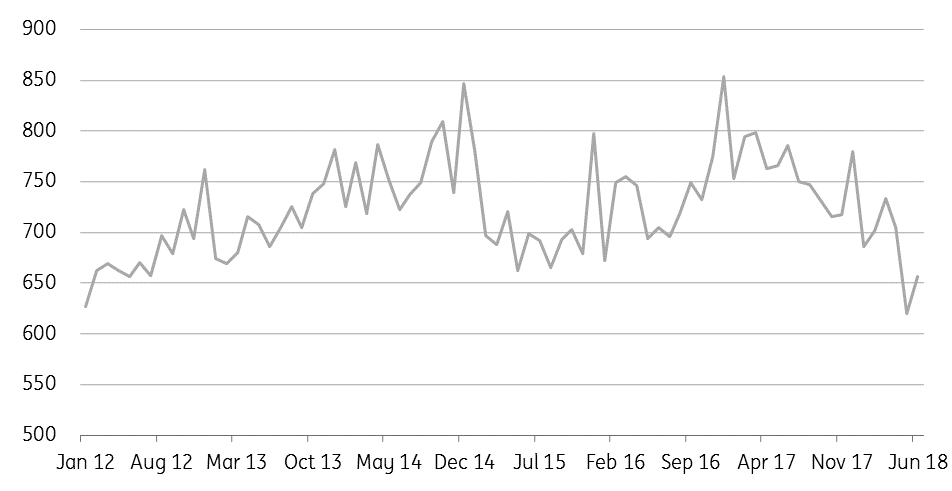
The average parity across the country stands at 60%, and so there is every incentive for motorists to switch over, and this is exactly what we are seeing. Monthly gasoline sales in the country have generally trended lower since the start of 2017, whilst over the same period ethanol sales have trended higher. YTD gasoline sales in Brazil through until the end of June have averaged 684Mbbls/d, down around 93Mbbls/d from the same period in the previous year, whilst ethanol sales averaged 275Mbbls/d, up 75Mbbls/d from the same period last year. This alternative option for motorists in Brazil has meant that we are actually seeing oil demand destruction in the country.
The feedstock for ethanol in Brazil is sugarcane, and given the significant global sugar surplus this season, and the expectation for another large surplus next season, sugar prices are likely to remain under pressure, pushing mills to maximise ethanol output.
Brazil domestic ethanol sales pick up
Brazil gasoline sales (Mbbls/d)
Content Disclaimer
This publication has been prepared by ING solely for information purposes irrespective of a particular user's means, financial situation or investment objectives. The information does not constitute investment recommendation, and nor is it investment, legal or tax advice or an offer or solicitation to purchase or sell any financial instrument.Read more

Included in the following bundle
In case you missed it: The contagion effect
- This bundle contains 8 Articles