Can sovereign wealth funds continue to ride the equity wave
Major investors are still reaping the rewards of long equity positions, despite fears of rich asset prices
Sovereign wealth funds perform well...
One of the largest Sovereign Wealth Funds (SWF) in the world, Norway’s Government Pension Fund, has reported another strong fund performance: 2.7% was the quarterly return on the fund in 1Q 2017 following an impressive 3.8% return in 1Q17. Returns were largely generated by equity investments. Norway has now saved a staggering $975bn for future generations.
We're highlighting this story now is because of the growing concerns over asset prices. The minutes of the July 25-26 FOMC meeting, released this week, saw Fed staffers revising their assessment of asset valuation risks to ‘elevated’ from ‘notable’.
If equity markets are to correct, it will probably be a function of:
- The risk-free interest rate rising (e.g. Treasury yields),
- Corporate earnings prospects taking a nose-dive (geo-politics could play a role here), or
- Positioning – (e.g. asset managers being exceptionally overweight equities.)
...but are they overweight equities?
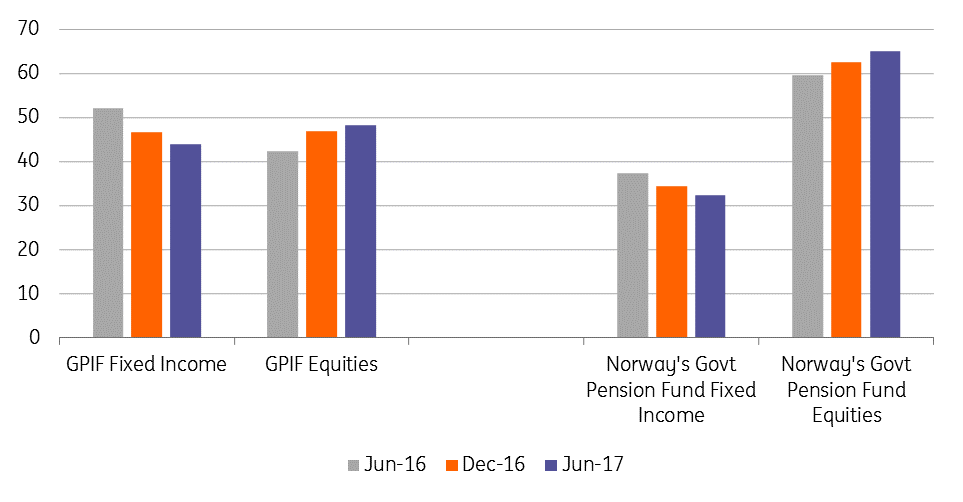
Focusing on the issue of positioning, some of the world’s largest asset managers have certainly increased allocations to equities over recent years. The chart below highlights the Fixed Income versus Equity allocations of the SWFs of both Norway and Japan (the GPIF with assets under management of $1.4 trillion).
Both have progressively cut Fixed Income and increased Equity allocations, and have done very nicely out of it. (Japan’s GPIF returned a healthy 3.5% in 1Q17).
Are these Sovereign Wealth Funds ‘overweight’ equities?
When asset managers are described as being over or under-weight a particular asset class, it is normally in relation to a benchmark asset allocation. Typically Finance Ministries determine these benchmarks for Sovereign Wealth Funds. As of the end of June, Norway’s SWF allocated 65% of its fund to equities. That is slap-bang in the middle of the 50-80% benchmark it has been given. And Japan’s GPIF, with allocations to domestic and foreign equities, at a combined 48%, is slightly below the 50% equity benchmark awarded to it.
We would add that Japan’s GPIF as of end June 2017 allocated 7.7% of its portfolio to ‘Short-term assets’ or cash, compared to a figure of 5.5% in cash in June 2016.
Combined with private sector surveys showing surprisingly high levels of cash amongst the buy-side – despite the long bull-run in equities – it seems the available evidence suggests the buy-side is far from being ‘limit-long’ risk assets.
SWFs percentage allocations to fixed income versus equities

P/E ratios for equities are high
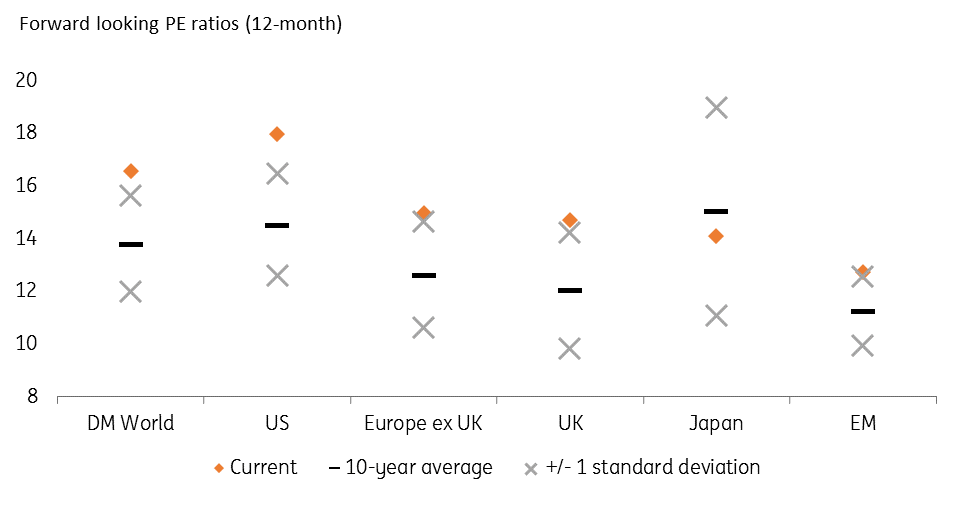
That said, conventional measures of equity valuation – such as 12 month forward–looking Price Earnings ratios are very high. This is especially the case for US equities. Yet our point here is that it looks like large asset managers are aware of this and are not over-committed in equity markets.
Forward looking PE ratios (12-month)

What does this mean for FX markets?
Until proven otherwise, we think moderate positioning in risk assets. and no clear signs of a slow-down in global growth. will allow investors to retain a glass half-full approach to currency investing – leading to continued demand for high yield currencies, especially the Turkish Lira in the EM world.
Download
Download articleThis publication has been prepared by ING solely for information purposes irrespective of a particular user's means, financial situation or investment objectives. The information does not constitute investment recommendation, and nor is it investment, legal or tax advice or an offer or solicitation to purchase or sell any financial instrument. Read more
