Why Brookings is right on China growth, and why we’re not surprised
- 14 March 2019
- China
Chinese growth since 2008 has been almost 2 percent lower than official numbers indicate, according to a recent Brookings research paper. We think the authors make a valid point, having used two independent approaches to the analysis and arriving at roughly the same outcome. The findings, however, shouldn’t come as a surprise

Ordinal or cardinal?
Saying that official Chinese GDP figures are not all they appear to be is a bit like saying that professional wrestling might not, in fact, be a competitive sport as claimed. But it is always helpful to be able to put some scale to that belief.
A recent Brookings Insitution paper has done just that, and in ways that seem highly credible. The report, titled "A forensic Examination of China's National Accounts" shows that Chinese GDP growth since 2008 may be close to two percentage points lower than the officially published figures suggest.
That means that at best, the official numbers are an ordinal measure of economic activity - helpful in terms of illustrating direction - but far more limited in terms of providing information about magnitude. It is not for nothing that alternatives to GDP, for example, the Premier Li index, have been popular unofficial supplements to the official data for years.
Crunching the numbers
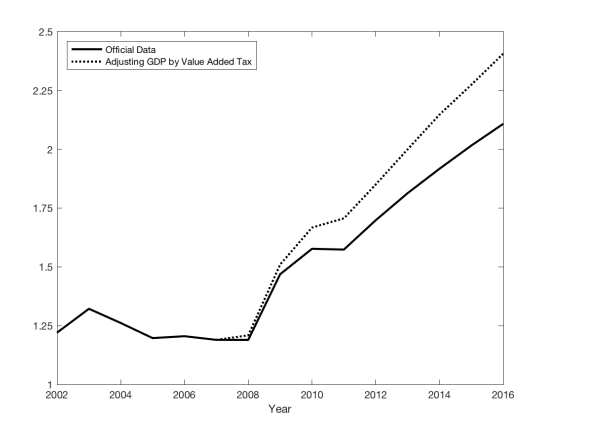
The four authors of this report take a rigorous approach to the data. Local GDP data is compared with national data, unveiling consistent discrepancies for industrial sector output and net exports. China's National Bureau of Statistics (NBS), attempts to reconcile the local figures which typically sum to more than the national total, by adjusting the figures down. By comparing the official numbers calculated in this way to GDP estimates based on value-added tax revenue growth reported by the State Administration of Taxation, the authors conclude that the adjustments made to local GDP were indeed roughly accurate up until around 2008. After then, the published data overestimate national GDP by around 1.7 percent per year.
The appeal of using VAT revenue data to adjust the figures is that the incentives to inflate these numbers are exactly the opposite to the incentives to inflate local GDP figures. That said, this does perhaps raise the prospect that systematic under-reporting of VAT revenue to avoid an offsetting fiscal adjustment might also bias the figures the opposite way. It's worth adding that when timely reporting is not an issue, tax data is often one of the most comprehensive and reliable sources of information on economic activity, so this is a minor caveat.
Top down meets bottom up
Moreover, the authors' bottom-up number crunching is supplemented by top-down statistical modeling. The model inputs include satellite night lights, electricity consumption, railway cargo flow, and trade flows. Many of these inputs will be familiar as inputs in the Li Kequiang index, and should also be relatively immune to human manipulation or mismeasurement. This statistical approach also found a structural break at 2008 consistent with the bottom-up analysis and supports the initial conclusions.
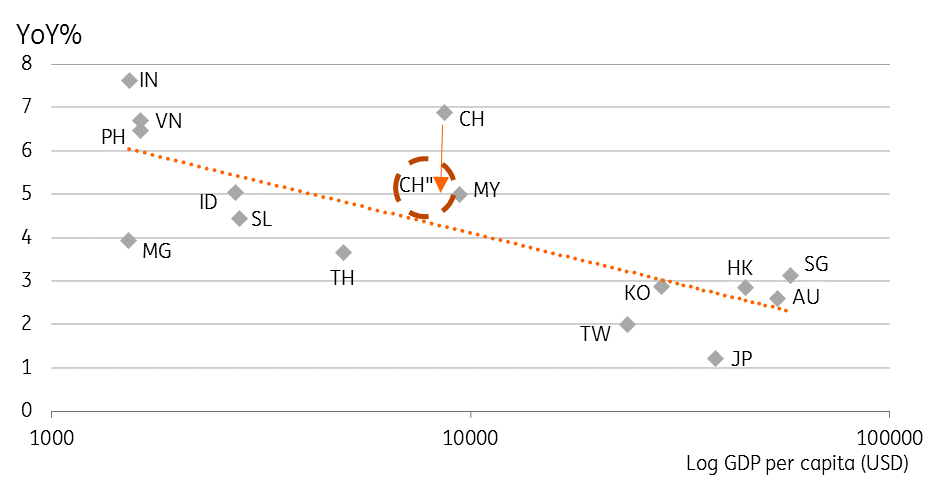
Average Asian GDP growth (4Y) and GDP per capita (log scale)
Does this matter?
On one level, the potential for inaccuracy in China's GDP reporting is neither surprising nor terribly concerning. It is what I refer to as the "Celsius versus Fahrenheit issue". In other words, we know that a GDP growth rate of 6% is not as good as a GDP growth rate of 7%. What we don't know is whether GDP growth of 6% is really "hot" or really "cold", or neither.
The potential for inaccuracy in China's GDP reporting is neither surprising nor terribly concerning
The Brookings paper doesn't get us much further, though to the extent that we can compare the newly computed Chinese figures with those for other countries in which we may have more trust, it might make comparisons easier. As a point of reference, GDP growth in Asian countries is explained to a large extent by the level of development (as measured by GDP per capita - also subject to mismeasurement, but measured on a log scale, this is far less serious). Such approaches show China as a massive outperforming outlier, though if we adjust Chinese growth in line with the Brookings paper suggestion (CH' in the chart above), it would lie much closer to the best-fit line. In other words, although the findings of the paper suggest that China is still growing fast for a nation at its stage of development, the discrepancy is credibly within the normal range of deviation.
Where the analysis is a bit more concerning, is in relation to China's debt to GDP ratios. With debt likely to be far more accurately measured relative to GDP, the analysis suggests that China's debt ratio might be about 30% (GDP) greater than ordinarily assumed. For those who worry about China's leverage, this doesn't provide any comfort. Total economic debt in China appears high relative to GDP even using official data, and very high for an economy at China's level of economic development. Though this data doesn't actually change that indebtedness, just our level of understanding.
Debt to GDP - official and re-estimated ratios
People in glass houses
Before we get too judgemental, it is also worth reflecting on other countries' measures of GDP. Within the Asia region, many historical GDP releases lack the quarterly volatility that you would expect from such data, which undermines their credibility. That isn't to say that they are overstated, but they do seem to be unnaturally smoothed. Even in developed markets, statistical approaches such as hedonic price adjustment could be argued to artificially inflate real GDP estimates, and downplay inflation. Where inflation is used to adjust public payments such as pensions over time, this can save governments billions of dollars, at the expense of their population's incomes.
Before we get too judgemental, it is also worth reflecting on other countries' measures of GDP
In truth, all measures of GDP are subject to the criticism that they provide only a partial description of the economic activity occurring at a national level. They frequently omit sizeable elements of economic activity, such as home working, grey or black market activity and voluntary work. All measures of GDP should, therefore, be considered as indicative measures of economic activity, rather than concrete representations of reality. The Brookings estimates shift China's GDP measurement in the direction of measures like EU and US GDP. But those measures themselves are far from problem-free.
You can download the full Brookings' report from their website here
Content Disclaimer
This publication has been prepared by ING solely for information purposes irrespective of a particular user's means, financial situation or investment objectives. The information does not constitute investment recommendation, and nor is it investment, legal or tax advice or an offer or solicitation to purchase or sell any financial instrument.Read more
Included in the following bundle

Good MornING Asia - 15 March 2019
- This bundle contains 5 Articles