Asia’s race to net-zero: China
China is the world’s biggest emitter of carbon dioxide. Its increasingly upper-middle-income economy is becoming a mass market for technology manufacturing. China has the biggest fleet of electric vehicles in the world but is still heavily reliant on fossil fuels. The environment, however, is becoming an ever more important political priority

China primary energy source, 2020

China is regularly labelled as one of the most polluting economies on the planet. But the environment has become an increasingly important political priority in China and in December 2020, the central economic workforce decided to set a target for achieving net-zero carbon emissions by 2060, and peak carbon emissions before 2030.
The government has since released a few papers on how to achieve these two targets. One is the 14th Five Year Plan, which provided detailed targets on greening the economy for 2021-2025, including reducing CO2 emission by 18% by 2025. Another is the New Era of China Energy Development published in December 2020, which set the policy direction in section 4. In February 2021, the National Development Reform Commission (NDRC) issued further guidance to speed up the transition to a green economy.
In addition to internal government policy papers, the Chinese government has also teamed up with international bodies to study the roadmap for reaching net-zero carbon emission targets by 2060. The studies include China 2050: A fully developed rich zero-carbon economy by the Energy Transitions Commission and China Renewable Energy Outlook 2019 (aka. CREO) by the Energy Research Institute of Academy of Macroeconomic Research / NDRC China National Renewable Energy Centre with technical support from various European energy agencies, including the Danish Energy Agency and Germany’s Energy Agency.
We apply the CREO’s estimate of electricity generation from renewable energy sources of around 65% to reach net-zero carbon emission. Then, as we have done for Korea and Japan, we combine this data with the IEA’s data* for capacity factors and capital costs per KWh for different modes of energy generation to arrive at a weighted cost for incremental electricity capacity requirements to attain net-zero carbon emission.
*IEA World Energy Outlook Annex B Table B 2b
China’s electricity generating mix 2060

Like our other country calculations, we assume for China that both the generating processes, as well as end-use transport will become more efficient over time. Consequently, our average cost per GWh of electrical work, energy and per GW of capacity will be lower by 2060. As noted in the introductory section to these country reports, we make the simplest assumption possible about the installation process, and our capacity costs are consequently a simple average of the 2020 costs and the 2060 costs for China.
Here is how it breaks down for China
Land transport – Passenger cars
Total energy demand from transportation was 14% of total energy demand in China in 2018, which was around 25,725,560 GWh. Among all types of passenger transport, passenger cars consumed the lion’s share, with 66% of total transport energy consumption. That is to say, passenger cars accounted for around 9% of overall energy demand in China in 2018.
Passenger transport is dominated by cars
China passenger transport (bn)

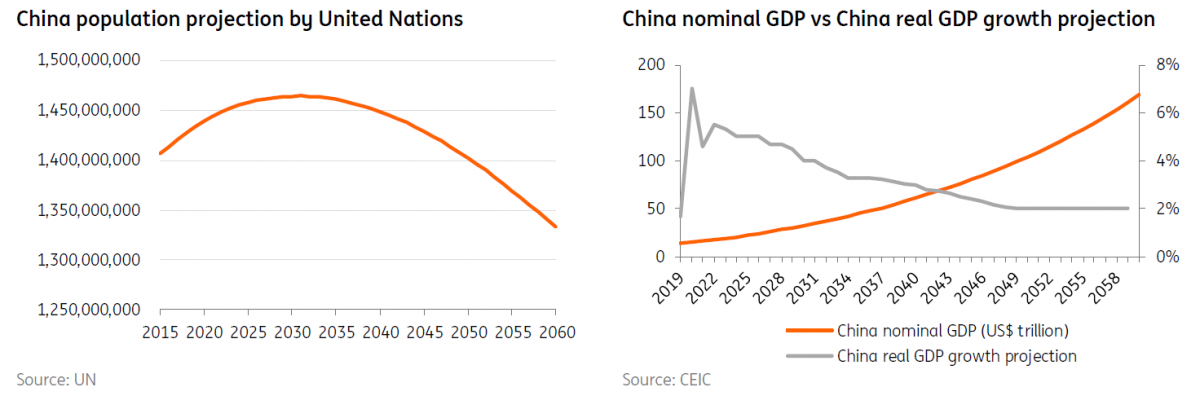
The CREO estimates that there will be 450m passenger cars in 2050, up from 220 million in 2018. This increase will be driven by 1) urbanisation and 2) wealth increases, which will offset the negative influences of a declining and ageing population. We further assume that the number of passenger cars won’t change from 2050 to 2060 as ageing will speed up while the process of urbanisation should have been largely completed.
Just as for Japan, partly for simplicity, but also because it seems unambiguously the most energy efficient approach, we have assumed that all passenger vehicles by 2060 are battery plug-in electric vehicles (BEVs) compared to the current fleet, which has only about 5 million “new energy vehicles” out of the total fleet of 220 million. This will deliver an immediate benefit in terms of energy efficiency gains compared to internal combustion powered vehicles. Total energy demand from passenger vehicles by 2050 could be as low as 79,500 GWh.
Backing out the electricity generating capacity required to deliver this energy requirement, and accounting for China’s projected generating mix, this will require only around 61GW of additional generating capacity at a total cost of US$516bn, or less than 0.09% of GDP on an annual basis if spread out over the entire horizon (i.e. from 2020 to 2060). This is only one part of the whole transport sector though and as noted for Japan, this surprisingly low result stems from:
- The inherent efficiency improvements of BEVs compared to the current fleet
- Additional efficiency gains for BEVs by 2060
- Decline in costs especially for renewable energy as it becomes more widespread.
Let’s now consider the other types of transportation.
Energy consumption (GWh) in China between 2020 and 2060 by mode of transportation

Commercial vehicles
We perform a similar calculation for buses and trucks. Road freight will increase to 29 trillion tonne-km in 2060 from 7.1 trillion tonne-km, contributing to 58% of total freight volume*.
*The Energy Transition Commission, China 2050 Page 40.
BEV is a less obvious choice for long haul commercial vehicles even if it is the economic choice for buses, as China has increased the use of BEV for buses.
Hydrogen fuel cells could be an alternative energy source for long haul trucks but while these are highly efficient vehicles compared to internal combustion engines, there are efficiency leakages in transport and re-filling, and the hydrogen production process is extremely energy intensive. So even for long haul vehicles, where the benefits of regenerative braking are less useful, it is not a clear choice.
Our calculations show that adopting green technology by commercial vehicles will require an additional 206GW of capacity and US$1,750 bn of capital costs, equivalent to 0.29% of GDP per year from 2020 to 2060.
Rail system
In contrast to Japan, China’s passenger rail demand is likely to increase to close to 4 trillion passenger-km in 2060* from 1.415 trillion in 2018 as there will likely be more trips per passenger in the future as wealth levels increase. Rail freight looks likely to grow strongly, too. CREO calculates this will grow by 260% to 7.4932 trillion tonne-km, up from 2.882 trillion in 2019 as more freight moves from air to rail.
*CREO page 136
We find that an additional 344GW of capacity will be needed to supply the rail system at a cost of US$2921bn, equivalent to 0.49% of GDP in 2020 terms each year over 40 years.
Rail energy consumption (GWh) in China

Aviation
In 2018, aviation in China had just over 1 trillion passenger-km and 27bn tonne-km of freight, using around 63bn litres of jet fuel. Most of the recent growth in aviation in China comes from passenger travel, which is expected to grow 5.4% p.a. for 20 years from 2018.
We expect that air cargo growth will be around 5.35% annually as the economy develops. There will be an increase in demand for perishable produce, e.g. food and plants. Slower growth in air cargo could continue with better rail networks within China and with increased rail links to Europe.
China expects that most jet fuel will be fossil fuel by 2050. And at this stage, hardly any China policy documents mention the use of sustainable aviation fuel (SAF) in the future for China. There is a plan to initiate the development of a roadmap for SAF in The Roundtable on Sustainable Biomaterials. But electrical power demand to produce SAF is high.
If, however, we assume that China also aims for 100% SAF by 2050/2060 (otherwise, this has to be offset with huge mitigation efforts - carbon capture is not practical for aircraft) then we calculate that China will use 6,226,763 GWh by 2060 for aviation, which implies a cost of US$2021bn, equivalent to 0.34% of GDP in 2020 terms for each year from 2020 to 2060.
Aviation and marine energy consumption (GWh) in China

Marine
Like Japan, marine transport is almost entirely freight. We can ignore the passenger sector as a result.
As we noted in the Japan note
There are widely differing outlooks on the future for shipping fuel. With some advocating a short-term shift to LNG as a bridging fuel. But with increasing concern about “methane slip”, one of the world’s biggest shipping companies, Maersk, has come out strongly against that. LNG is also a fossil fuel and even ignoring methane slip, which is hard to do, countries like Japan would need to mitigate against the CO2 emissions, and shipping companies needing to buy new ships might find them unprofitable within their economic lifetime. The alternative fuel source is ammonia.
China’s own specification on green sea freight helps lower this high cost a little. Demand for sea freight is estimated to be around 120% of today’s levels by 2060. But the increase in demand for energy from additional shipping will be offset by reduced energy use following China’s own standardised technical specifications for green designs for ships, and, China’s green policy to speed up replacing and transforming old ships with greener ships. These two policies are estimated to offset 60% of sea freight energy use between now and 2060.
It is questionable whether the estimated growth of sea freight of 120% between 2021 and 2060 is too small. But we have also considered that high investment costs will be passed on to users and they now have some alternatives, for example China-Europe rail.
The additional electricity generating capacity costs to create green ammonia for shipping would require an additional 433GW of capacity with a capital cost of US$3,679bn, equivalent to 0.61% of 2020 GDP each year until 2060. It is extremely costly to shift completely from diesel and LNG to green ammonia.
One alternative would be to import the ammonium or hydrogen from overseas. For example, blue ammonia from the Middle East with appropriate local carbon capture and storage measures or green hydrogen from countries with abundant wind, solar PV, hydro-electric or geothermal power sources.
However, this basically just externalises the costs of capacity installation, and creates an ongoing cost to the economy in terms of the net drain on GDP from imported green energy.
Green Ammonia Production

Conclusion
When we add up all the costs to achieve net-zero carbon emissions for the transport sector in China, it amounts to about US$11 trillion, which is 1.8% of China GDP in 2020 terms per year for 40 years. The marine sector needs the most investment to be entirely zero carbon by substituting diesel and LNG with green ammonia, followed by rail then aviation. This study shows that the cost of achieving zero carbon emissions for the transport industry is extremely high. And this only considers investment costs for electricity generation for the transportation industry. These costs will likely be shared by the government and the private sector.
Additional capital costs required to achieve zero carbon emission by 2060 for China (US$bn)

In contrast to our figures, the People’s Bank of China governor estimated CNY141 trillion in investment would be required for CO2 reduction (equivalent to US$23.5 trillion at a USD/CNY exchange rate of 6.0). However, that was a figure for the full economy. Our calculation is for just part of the transition process. Whatever the sum, the amounts are considerable, and some will be funded by the market in the form of green bonds, green loans and other sustainable finance instruments.
As of the end of 2020, China’s green loans outstanding stood at around US$1.8tn with green bonds outstanding at US$125bn, ranking as the largest and second largest markets in the world for these instruments, respectively.
Download
Download article7 September 2021
Asia’s race to net-zero: 12.4 trillion dollars and counting This bundle contains {bundle_entries}{/bundle_entries} articles"THINK Outside" is a collection of specially commissioned content from third-party sources, such as economic think-tanks and academic institutions, that ING deems reliable and from non-research departments within ING. ING Bank N.V. ("ING") uses these sources to expand the range of opinions you can find on the THINK website. Some of these sources are not the property of or managed by ING, and therefore ING cannot always guarantee the correctness, completeness, actuality and quality of such sources, nor the availability at any given time of the data and information provided, and ING cannot accept any liability in this respect, insofar as this is permissible pursuant to the applicable laws and regulations.
This publication does not necessarily reflect the ING house view. This publication has been prepared solely for information purposes without regard to any particular user's investment objectives, financial situation, or means. The information in the publication is not an investment recommendation and it is not investment, legal or tax advice or an offer or solicitation to purchase or sell any financial instrument. Reasonable care has been taken to ensure that this publication is not untrue or misleading when published, but ING does not represent that it is accurate or complete. ING does not accept any liability for any direct, indirect or consequential loss arising from any use of this publication. Unless otherwise stated, any views, forecasts, or estimates are solely those of the author(s), as of the date of the publication and are subject to change without notice.
The distribution of this publication may be restricted by law or regulation in different jurisdictions and persons into whose possession this publication comes should inform themselves about, and observe, such restrictions.
Copyright and database rights protection exists in this report and it may not be reproduced, distributed or published by any person for any purpose without the prior express consent of ING. All rights are reserved.
ING Bank N.V. is authorised by the Dutch Central Bank and supervised by the European Central Bank (ECB), the Dutch Central Bank (DNB) and the Dutch Authority for the Financial Markets (AFM). ING Bank N.V. is incorporated in the Netherlands (Trade Register no. 33031431 Amsterdam).