5 reasons why we expect higher oil prices
We see oil prices trending higher in 2019, with the view that OPEC+ cuts are sufficient to return the market to balance over 1H19. Meanwhile, the current price environment offers little incentive to US producers to pick up activity. The obvious risk is the state of the global economy and concerns of a slowdown but here are five reasons why we see higher prices
ING oil price forecasts
OPEC+ cuts
In December OPEC+ finally agreed to cut output by 1.2MMbbls/d for a six month period, starting 1 January, with the deal set to be reviewed in April. The aim of the cut is to bring the global market back into balance over the first half of 2019, something we believe will be achieved assuming members comply with the deal. Given the group's over compliance in the previous deal, there is little reason to believe that it won't comply this time around.
Saudi Arabia once again appears to be carrying the deal, and they have already made significant cuts. The Kingdom pushed output to a record 11MMbbls/d over November, before falling to around 10.65MMbbls/d in December. For January, the Saudi Oil Minister has insisted that output will fall to 10.2MMbbls/d. Current price levels are putting pressure on the Saudi economy, the Kingdom has a fiscal breakeven oil price of above US$80/bbl, and Saudi’s budget for 2019 certainly doesn’t help, with plans to increase public spending by 7%. We don’t believe that this means the Saudis will try to push prices above US$80/bbl, given demand destruction concerns and political pressure, but they certainly would like prices higher than current levels.
Russia is certainly key to the deal, without them, one would have to question the viability of any deal. This is the very reason why in the lead up to any OPEC+ meeting, there is plenty of focus on Russia and their willingness to cut output. Russia has a fiscal breakeven oil price estimated in the region of US$50/bbl, and so are not under as much pressure as other producers to cut. Although, had they not agreed to cut output at the end of last year, prices would have likely traded lower. If we look at Russian output, they produced a record 11.45MMbbls/d over December, up from 11.38MMbbls/d in November. Under the latest deal, Russia agreed to cut output by 228Mbbls/d from October levels- a month where production averaged 11.42MMbbls/d. The Russian Energy Minister has said that it will take a while to cut output but estimated that in January, production would be around 50Mbbls/d lower than October levels. We don’t think that this gradual reduction reflects Russia’s unwillingness to comply with the deal, but more the fact that operationally they need time to reduce output. Under the previous deal, it took Russia five months to get close to their targeted cut. The issue this time around though, is that the deal is only for a six month period initially, so assuming there is no extension, and that Russia continues to take a while to fully reach its targets, then their compliance over the course of the deal could fall short.
We believe the risk of non-compliance comes from Iraq. In the previous deal, Iraq failed to hit its target cut, with the exception of one month. Iraq’s compliance over the two-year deal came in under 40%, the worst performer amongst OPEC members. Under the new deal, Iraq has agreed to cut output by 140Mbbls/d from October’s level of 4.65MMbbls/d.
Saudi output set to fall 800Mbbls/d from November highs

Canadian production cuts
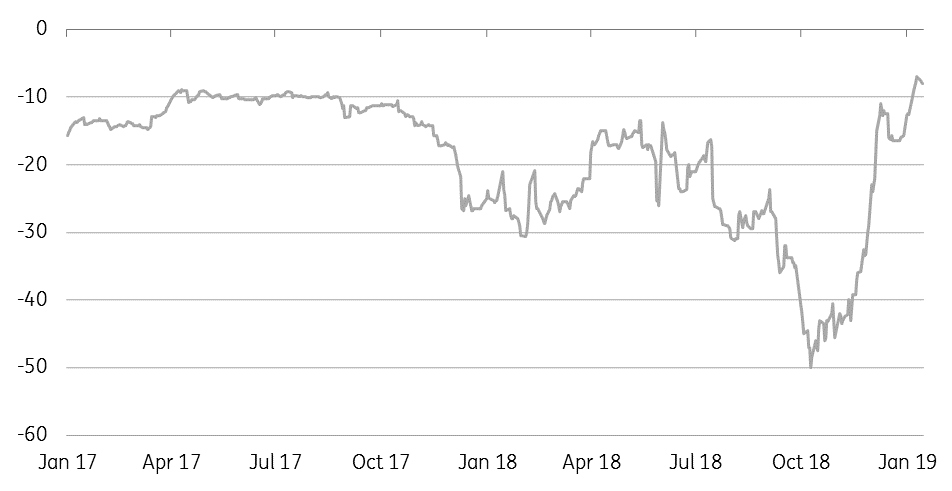
The province of Alberta in Canada took drastic action towards the end of last year, announcing mandatory production cuts for producers starting in January. Producers are cutting output by a combined 325Mbbls/d until domestic inventories have returned to more normal levels, after which the cut would be reduced to 95Mbbls/d through until the end of 2019. These cuts appear to be working well for the industry, with the WCS/WTI differential narrowing from a discount of US$50/bbl in mid-October 2018 to less than a US$7/bbl discount recently- the narrowest differential since 2009.
In fact, WCS delivered to Cushing is not too far from parity with WTI, assuming logistical costs in the region of US$5.45 to US$6.85/bbl. Why is this interesting? Well this appears to highlight a broader issue in the global oil market, where the bulk of growth in supply we are seeing is in lighter crude oil, while medium/heavy oils are facing supply issues- consistent declines in Venezuela, Canadian production cuts and the fact that under the OPEC+ deal, members are likely to cut heavy crudes first.
WCS/WTI differential narrows on the back of Canadian cuts (US$/bbl)

A balanced global market
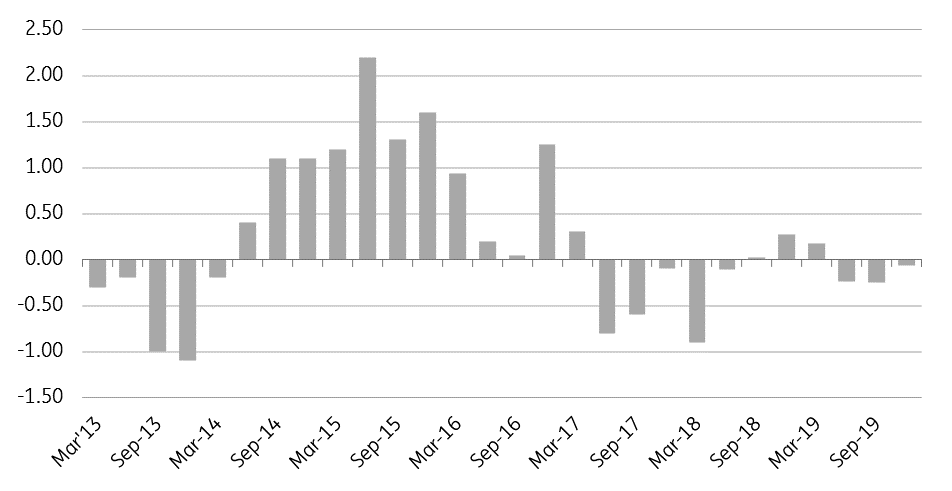
Cuts implemented by OPEC+, along with the mandatory cuts in Alberta, Canada, mean that the global oil market should be largely balanced over the first half of 2019, assuming that members of the deal comply with the agreement. We see little risk for upside surprises from other non-OPEC producers such as the US- given the current price environment. Saying this though, it may take several months for the market to return to balance, 1Q is seasonally the low point in oil demand, whilst Russia has said that it would gradually reduce output- much like we saw under the previous deal.
As we move into the latter part of the year, we do forecast marginal deficits for the market. How these deficits evolve between now and then will largely depend on OPEC policy, US production growth, and US sanctions on Iran. Current waivers for buyers of Iranian oil are set to expire in April, and the market will be watching closely if further waivers are granted. Although the US has recently said there are no plans to grant further waivers.
Oil market set to be largely balanced (MMbbls/d)

Slowing US supply growth
We believe that a sustained period of weak oil prices will only mean higher prices in the latter part of 2019 and into 2020. There is no denying that the bulk of non-OPEC supply has come from the US, and this is a trend that is only expected to continue into 2019. However, with WTI trading around US$50/bbl, and prices in the Permian at a US$5/bbl discount to WTI, some producers have already made clear their intentions to cut back on spending in 2019. Those who continue with planned projects have the option of building up DUC inventory, holding off for more attractive prices. Depressed prices are a risk to supply growth as we move through this year, and into 2020. This raises the possibility that the global market sees larger deficits over the second half of 2019.
Currently, the EIA forecasts that US output will average 12.1MMbbls/d in 2019, up from an estimated 10.9MMbbls/d from 2018. While in their latest Short Term Energy Outlook, the EIA’s first forecast for 2020 puts production at 12.9MMbbls/d.
Speculative positioning
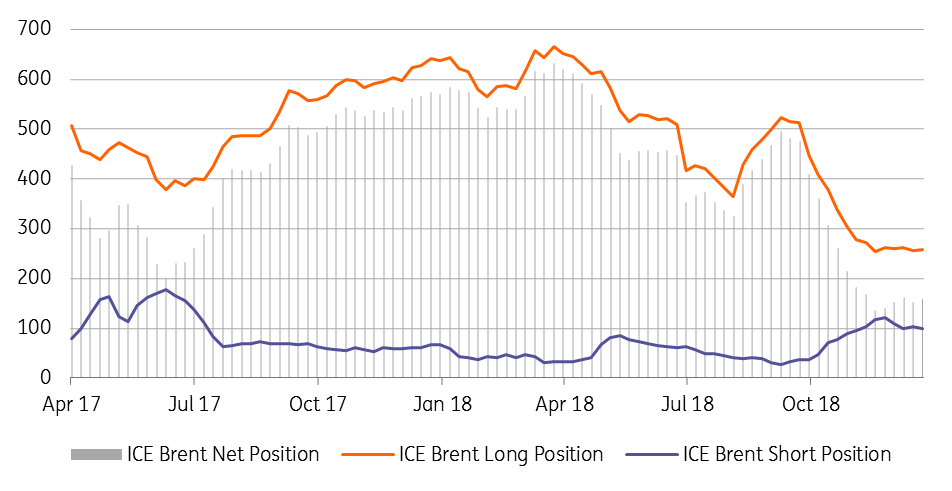
Speculators continue to hold a fairly neutral position in ICE Brent. As of 8 January, the managed money net long stood at 158,146 lots- down from close to 500k lots at the end of September. All measures suggest that speculators hold a neutral position- the US dollar value of the net speculative long is under US$10 billion currently, compared to around US$41 billion in late September, and lower than the two-year average of a little over US$27 billion. Meanwhile, the long/short ratio also stands at 2.6 versus an average of 10.5 over 2018.
However, speculators are likely to remain reluctant to enter the market until there is some clarity over the effectiveness of OPEC+ cuts. Macro money is likely to make a return only when broader market sentiment improves- a catalyst for this would be something along the lines of a trade deal between the US and China, or failing that, effective stimulus programmes from China. Finally, assuming that OPEC is successful in bringing the market to balance, this should also mean a strengthening in time spreads, which should also make the market more attractive for speculative longs, given the roll yield.
Neutral speculative positioning in ICE Brent (000 lots)

This publication has been prepared by ING solely for information purposes irrespective of a particular user's means, financial situation or investment objectives. The information does not constitute investment recommendation, and nor is it investment, legal or tax advice or an offer or solicitation to purchase or sell any financial instrument. Read more
