2020 FX Outlook: Diamonds in the rough
- 28 November 2019
- FX
In an FX market priced for secular stagnation, our call for 2020 is to identify undervalued currencies able to hold their own against the dollar – but are also backed by yield and growth. Screening for these characteristics, we find commodity currencies should perform well in 2020. But what of the dollar? Unlike others, we don't see a clear dollar bear trend


- Somewhat surprisingly 2019 produced strong returns in most asset classes. And many calls, including our own, that the dollar would peak may still prove correct. Yet the dollar story in 2020 looks far from straightforward. Instead 2020 looks like it will be a ‘currency-pickers’ market, with our job to identify relative value.
- Making a call on the trade environment looks almost impossible. All we can say is that with the industrial sector already in recession, we doubt world trade volumes can fall much further. After all, this is not the global financial crisis, where the financial plumbing of world trade – trade-credit – completely seized up.
- Instead, we see world trade building a base and – after a period of inventory draw-down – some stabilisation in the industrial sector. Softening growth and money printing central banks will likely keep G3 currencies relatively range-bound during this period. The bigger story for 2020 will be total return considerations.
- In an FX market priced for stagnation, we think investors will favour undervalued currencies, offering both yield and growth. Screening for these criteria, we see outperformance in many commodity currencies in 2020 – both in the DM and EM space. Also, we expect EUR to increasingly become the funding currency of choice.
Maybe the dollar does peak in 2019
This time last year in our 2019 FX Outlook entitled Peak Dollar, we felt we could see some modest dollar strength against the low yielders through the early part of the year, but ‘as 2019 progresses… a safe descent from the dollar summit should start the great rotation out of the US and into the undervalued asset markets overseas’.
Nobody is talking about a ‘great rotation’ at the moment, but a few are talking about a broad dollar decline in 2020 on the back of the end in US exceptionalism. We still have some sympathy with this story, but do not see the 2020 FX narrative as simply one of a clean dollar bear trend. And certainly, we do not see 2020 delivering many of the bullish FX outcomes witnessed in 2017.
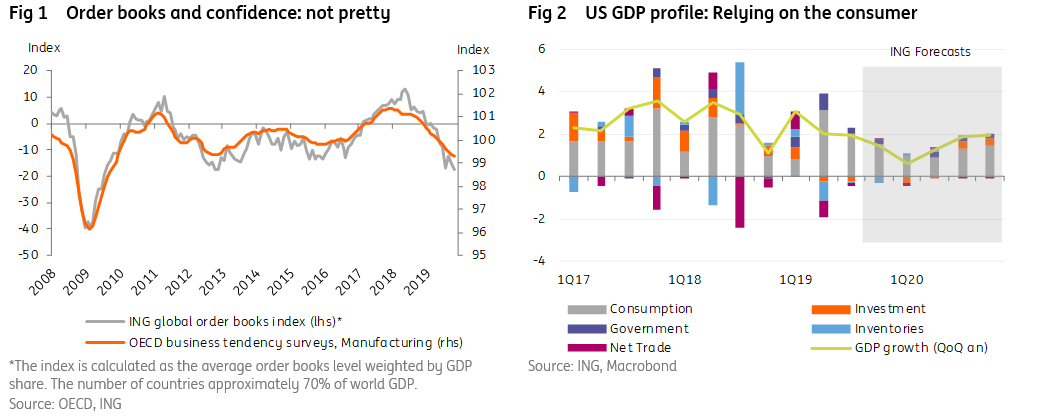
Let’s take stock of where we are at the moment. Most leading indicators of activity (mainly industrial) are heading lower and are in contraction territory. These are mainly the manufacturing PMIs and business confidence surveys, reflecting an industrial sector already in recession. The big question is whether low unemployment rates can sustain consumption and buy time for the industrial cycle to turn?
The US economy is a good case in point here. After the fiscal-fuelled boom of 2018, the US economy has started to slow. Leading that decline has been investment, which has not contributed to growth since 1Q19 and may not contribute to growth until 3Q20. That places an inordinate burden on the US consumer.
However, our team still looks for US consumption to offset investment in 2020 and deliver a full-year growth rate of 1.4%. That is slow by US standards, but far from a hard landing
As fears of a 2020 US recession have dissipated, even the much maligned US yield curve has turned higher on the view that this year’s three Fed rate cuts – plus some rapprochement between Washington and Beijing – can stave off any hard US landing. As we have noted frequently this year, we think the US yield curve has been a good barometer for risk appetite and secular stagnation fears have largely been a dollar positive.
In theory then, could a steeper US yield curve spark a negative turn in the dollar more broadly? We have two issues with that:
1) Our rates strategy team see the US 2-10 year curve locked in a zero to 30bp range for 1H20, largely based on the soft US macro view and the possibility of one or two more Fed rate cuts expected by our US macro team. 2) Even if the dollar did start to sell off, we doubt European currencies would be major beneficiaries, largely because this is not 2017 – when pent up European optimism was unlocked after the French election and the ECB signalled the ‘all-clear’ on the deflation scare.
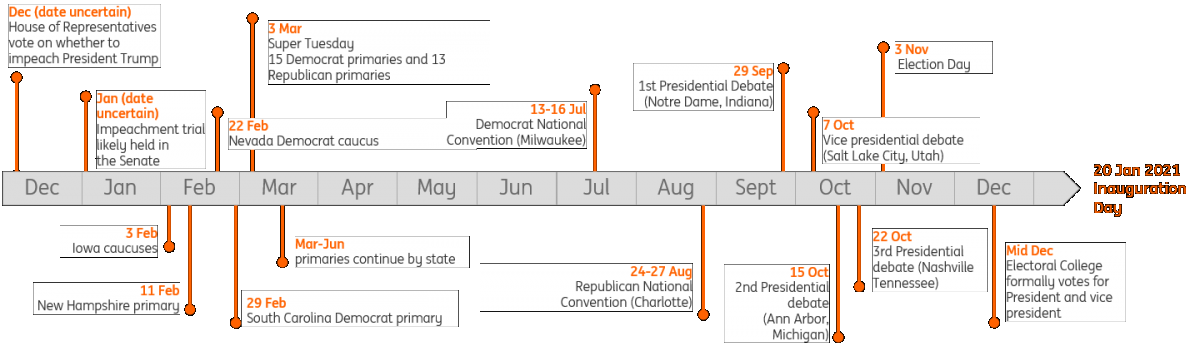
What November 2020 means for USD
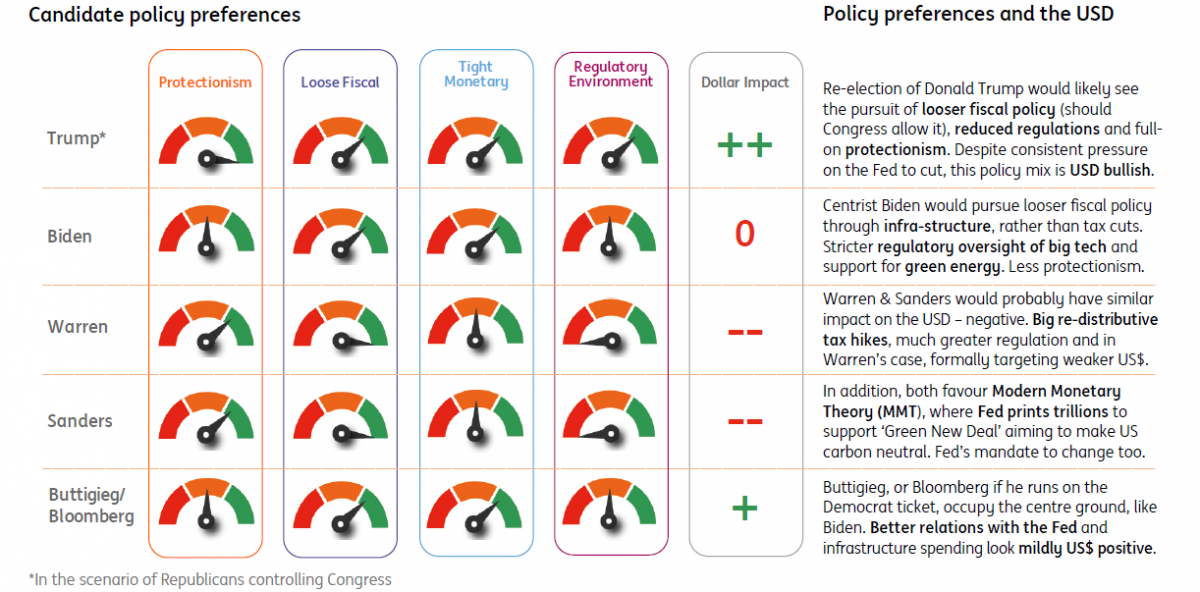
When examining the presidential election and its implication for economic policy there are three key areas to focus on. Firstly, there is the stance of fiscal policy. Loose fiscal policy, either through lower taxes, more spending, or a combination of the two typically results in the Federal Reserve running tighter monetary policy. Historically this has been a positive backdrop for the US dollar.
Secondly, there is the regulatory framework. Tighter regulations may be interpreted as a hindrance to business activity and may lower growth even though, if properly implemented, it provides safeguards and can create incentives. The perception of slightly weaker growth may result in lower interest rates and be a mild dollar negative.
Then, thirdly, there is protectionism. The implementation of tariffs as a tool to extract trade concessions under Trump’s Presidency has hurt business sentiment by creating uncertainty and raising costs. With China responding in kind, both economies have experienced headwinds. Amidst weak global growth the US economy has outperformed and the dollar has stayed firm. If trade tensions were to persist then this could maintain a safe haven bid for the dollar. Should they ease then this could create an environment for better global growth and see investment flows start to move out of the US dollar.
Three themes for 2020
Theme 1: Bottoming growth
Protectionism has frustrated global growth for a second year and, in the case of Asia, pressure from the trade war has been compounded by the low-point in the global tech cycle. Our baseline view sees a marginal pick-up in global trade volumes into 2020, though our trade team feel that 5-10% YoY growth rates may be a thing of the past – supply chains having been shortened after the 2018-19 trade shock.
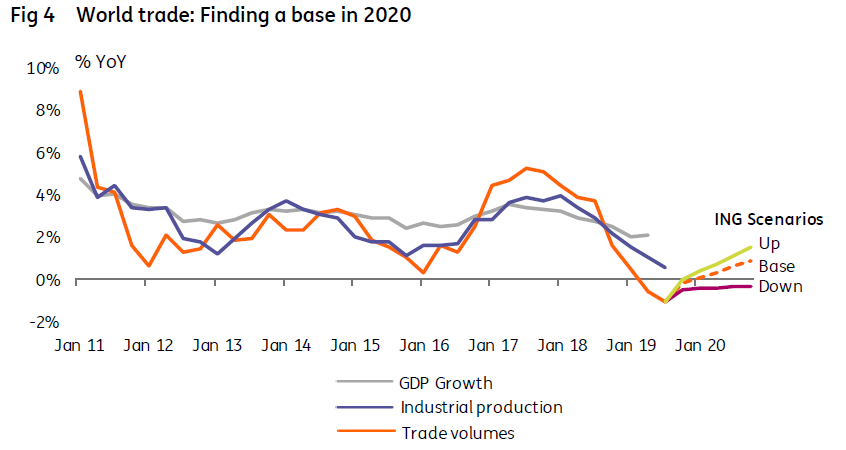
As highlighted in Figure 4, our trade team’s expectations for trade volume growth in 2020 are very conservative – but importantly their bearish scenario assumes that things do not get materially worse than we are witnessing currently – ie, a modest contraction.
In all, our macro team see 2020 global growth around or slightly above 2019 levels although there will be a growing disparity between the DM and EM economies.
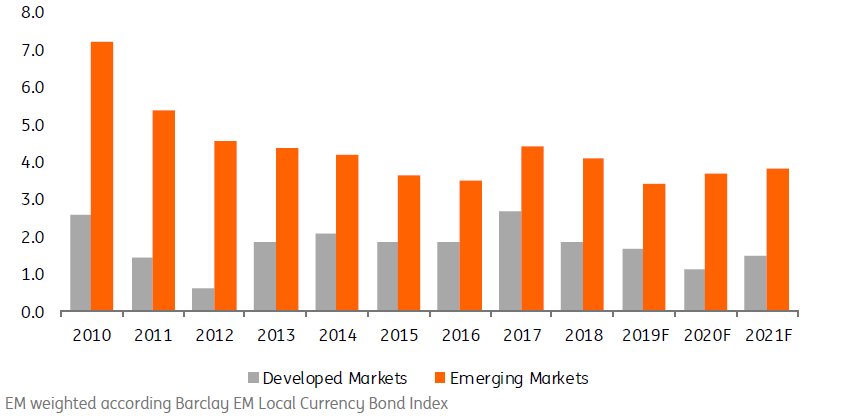
In 2020 DM growth slows for a third year in a row, while EM growth finally rises
Indeed, it will be no surprise that investors will be looking to EM shores in 2020. In Figure 5, we highlight ING’s growth forecasts for 2020 and 2021 in both the developed and emerging markets. The main take-away for 2020 is that aggregate DM growth slows for a third year in a row, while EM growth finally rises. After all, some of these large EM monetary easing cycles and big currency declines should be providing some support.
These diverging growth rates will have some significant implications for interest rate policies and also capital flows as flat or negative yield curves in the G3 space prompt pension fund managers to search further afield in terms of yield.
Historically, asset and liability matching has been a major challenge for the Japanese pension fund industry. But into 2020, expect to hear more of European pension funds with low coverage ratios forced to look further afield (increasingly outside of the G3) in search for higher-yielding products.
DM versus EM GDP performance and ING forecasts (% annual)
Looking within the DM and EM currency blocs, we note the following: G3 economies look to slow quite steadily. That effectively represents policy paralysis in Europe and Japan at a time when the US is moving deeper into its late cycle status. For reference, we see the US slowing down to 1.4% in 2020 versus 2.3% in 2019, and the Eurozone and Japan dropping to 0.7% (1.1%) and 0.2% (1.2%), respectively.
While we do see a modest slowdown in Chinese growth, we are looking for recoveries in the likes of Brazil, Russia, Mexico, India and several other Asian countries. Unlike many in the market, we tend to agree with the IMF that EM growth will be sufficient to offset the DM slowdown and keep 2020 world growth at similar levels to this year. That’s not bad.
Within the EM FX space, CEE is the only region that will not show an improvement in growth next year
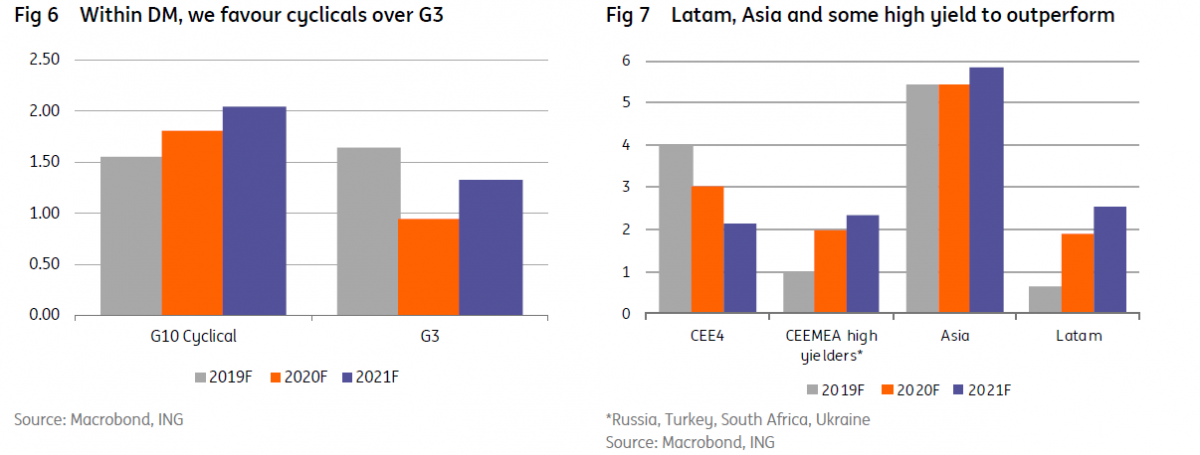
From an FX perspective, the above means the following: (1) the growth outlook favours EM FX versus DM FX (Figure 5); (2) within the DM/G10 FX space, cyclical currencies should be better positioned versus the major, low yielding currencies where growth is slowing (Figure 6). This means that USD, JPY and EUR should lag AUD, NZD, CAD or NOK; and (3) within the EM FX space, CEE is the only region that will not show an improvement in growth next year (Figure 7). With local CE4 currencies being low yielders, they should generally underperform the high yielders in the rest of world, where growth is set to accelerate. The still depressed volatility environment further supports this case.
Theme 2: Low volatility favours carry
When setting the scene for 2020 it is also worth considering the volatility environment. Will 2020 be a late cycle, tighter liquidity environment which would typically mean higher volatility and outperformance of the safe haven currencies? Probably not. Instead the Fed has prematurely stopped its misnamed quantitative tightening – having found the biting point in US money markets where liquidity was deemed as scarce. And our US macro team actually see risk of one or two more Fed cuts in early 2020.
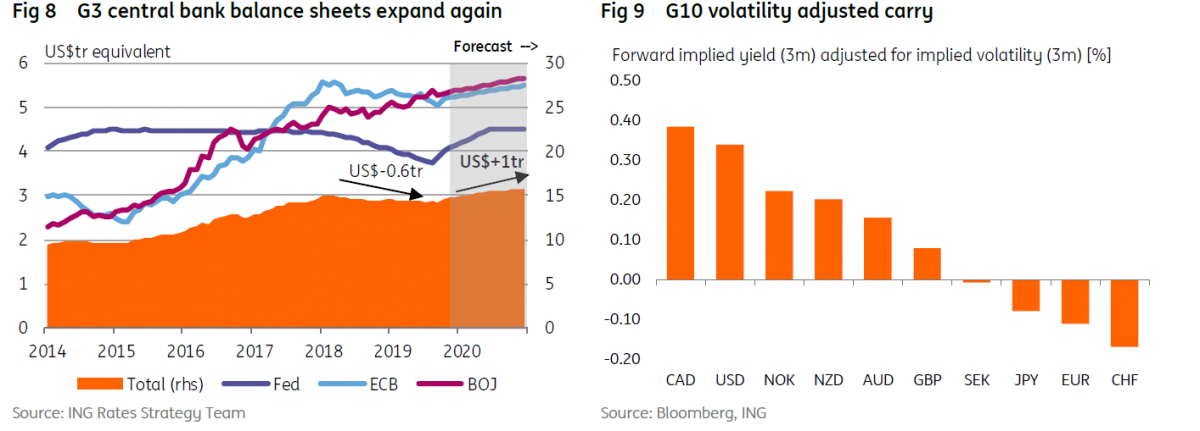
This comes at a time when the BoJ’s balance sheet is still growing (by around 4% of GDP per year) and the ECB has re-started asset purchases. After US$600bn of balance sheet shrinkage since 2018, it looks like G3 central balance sheets could revert to growth of around US$1trn by the end of 2020. Thus, the case for a volatility pick up on a late cycle liquidity withdrawal has therefore evaporated, undermining those bull cases for both JPY and CHF. And low volatility typically supports carry trade strategies – suggesting continuing demand for the USD and commodity currencies – largely at the expense of Europe.
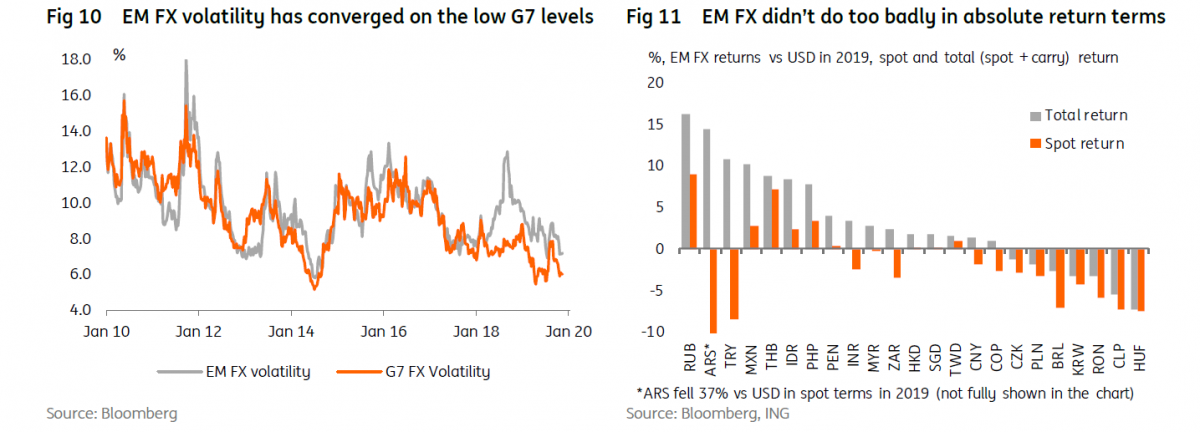
Bottoming growth, the stabilizing US-China trade conflict and the depressed FX volatility environment will in our view benefit EM high yielders. As Figure 11 shows, EM FX has not performed too poorly so far this year in absolute return terms (two-thirds of EM currencies actually showed positive return versus USD – grey line). This is quite an achievement in a year where declines in trade volumes and global growth would not be seen by many as EM FX carry friendly.
Were trade and growth to stabilize/improve next year, this EM FX segment should offer even better returns, with the carry component being also accompanied by some positive contribution from potential spot gains (as opposed to this year, where the majority of EM currencies depreciated versus USD in spot terms – orange bar Figure 11).
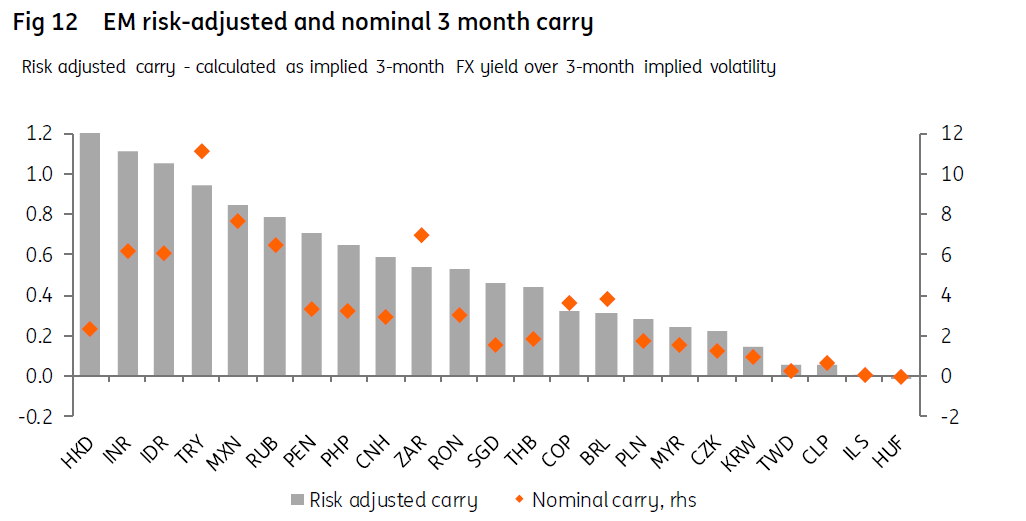
However, as long as there are limited idiosyncratic negatives for the dollar, 2020 EM FX appreciation in spot terms versus the dollar is unlikely to be overly aggressive (ie, not a one-way, across-the-board dollar decline). This means that the carry component will remain the key part of the expected EM FX return. Figure 12 shows those currencies that offer the best risk-adjusted carry potential. The Asian high yielders stand out both in nominal and risk-adjusted terms as do some EMEA high-yielders and the MXN. TRY continues to offer attractive yields, but double-digit inflation warns that carry gains are undone by nominal depreciation.
But growth and carry alone may not be enough to deliver FX outperformance in 2020. Since the global economy will not be firing on all cylinders and the vagaries of US-China politics will play out, a third factor needs to be taken into consideration: valuation.
Theme 3: Search for undervaluation
Above we make the case that some of the better growth rates and carry for 2020 is to be found in the EM world. We will start then with a look at EM FX valuation. And our basic premise here is to look for currencies priced for secular stagnation and at least identify those cheap enough to hold their value, even if global growth conditions deteriorate.
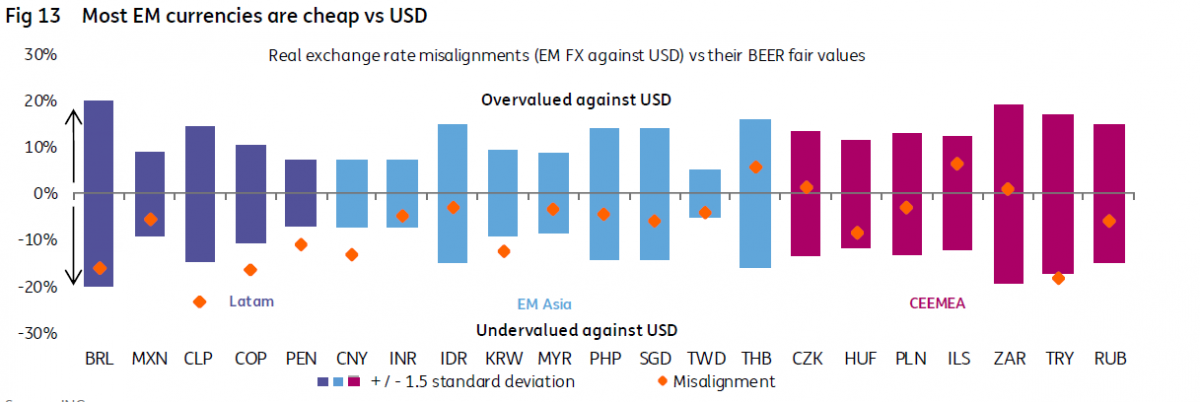
A large majority of EM currencies are cheap against the dollar (Figure 13). In terms of regions, Latam and EM Asia offer only cheap currencies versus the dollar (with the exception of THB), while all of the regional high yielders also look undervalued.
In contrast, the CEEMEA region offers clear diversity in terms of valuation. It hosts: (a) the most expensive currency (ILS); (b) the cheapest currency (TRY); (c) the least attractive EM high yielder (ZAR).
And given the region is populated by a high number of low yielders (which, with one exception, are not attractive from the valuation point of view), we would expect the CEEMEA FX region to underperform the other two EM regions in terms of returns in 2020. With CEE economic growth projected to slow the most next year (in terms of difference versus 2019) this corroborates the case for underperformance versus its global EM peers. Thus, value seems to be in the Latam and EM Asia spaces.
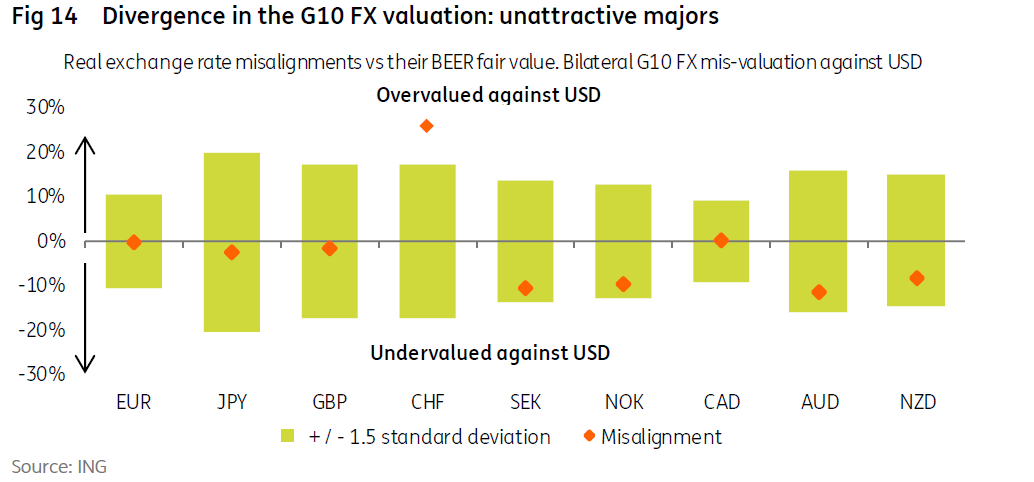
Within the G10 FX segment, there is clear divergence between the dollar valuation against other low yielding major currencies, such as EUR, JPY or GBP (being close to its fair values, but undervalued vs CHF) and the pro-cyclical currencies such as NOK or AUD (where the dollar is in most cases meaningfully overvalued). This is evident in Figure 14.
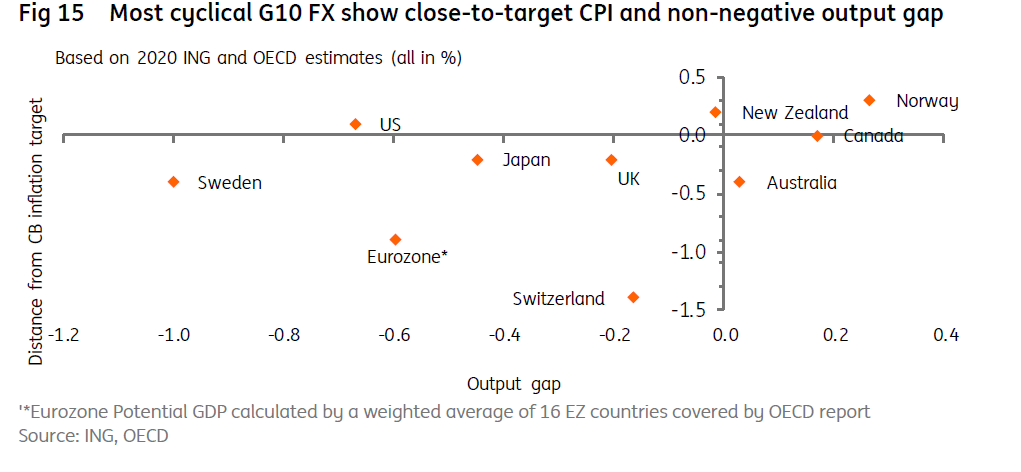
Bar the SEK, all the cyclical G10 currencies also show a positive or close to neutral output gap and inflation close to target - as illustrated in Figure 15 (these currencies are in the desirable top-right quadrant). We say desirable here, since central banks in these economies may be less prone to more aggressive monetary easing.
Again with the exception of the SEK, the cyclical G10 FX segment offers relatively good yield (Figure 9). All this makes most of the G10 pro-cyclical currencies an attractive proposition for 2020, in our view.
Conclusion: Diamonds in the rough
Into 2020 then, it looks a question of wading through the pessimism and trying to dig out currencies that could shine. The starting point, we believe, is to use the screening criteria we have outlined above.
Of the G3 currencies, notably the USD only appears under the carry criterion. The EUR and JPY do not feature anywhere and we particularly like the EUR as a funding currency in 2020. In this publication we are also revising up our USD/JPY forecasts, looking for a 105-110 trading range through 2020.
In the DM space, we think the NOK meets all three criteria and we forecast close to 7% total returns in NOK against the USD by the end of 2020. CAD meets two of the criteria and should deliver 6% total return over the same period. The AUD screens well, although we are worried by the risk of RBA QE in 2Q20 – which would be very negative for AUD. In that region we prefer NZD over AUD, especially in 1Q20.
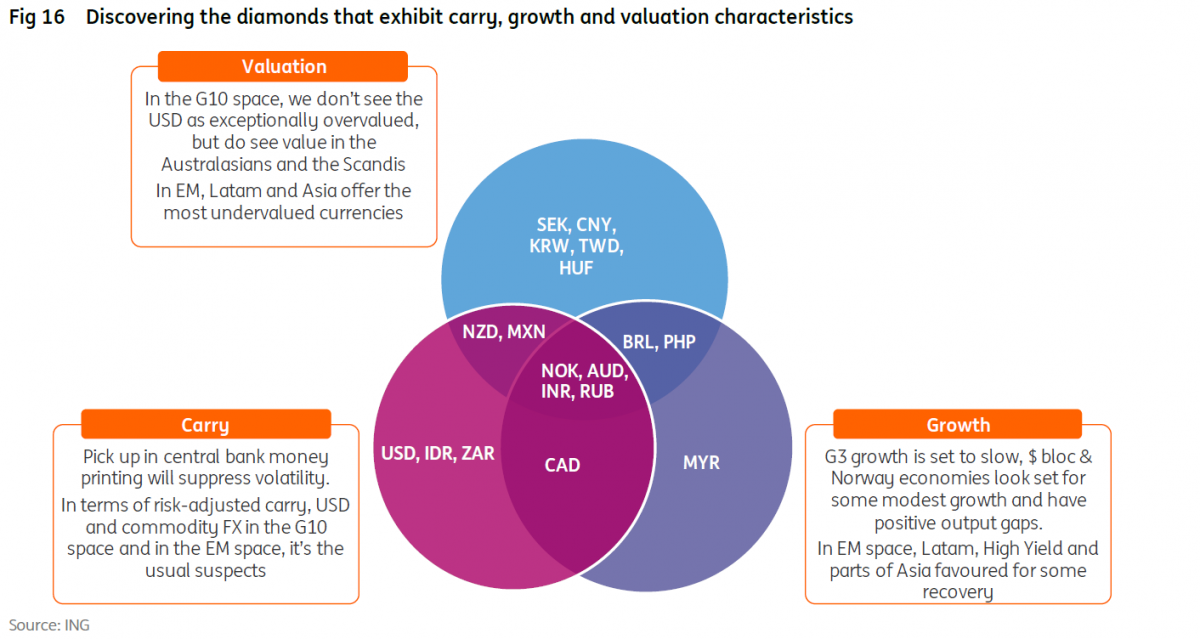
In the EM space, on a total return basis we highlight BRL, which could deliver 10%+ against the dollar by the end of 2020. The RUB meets all the criteria, but we favour holding the position only through 1Q20 (and against the EUR to pick up additional yield). The INR screens well, but twin deficits suggest gains will be seen purely from the carry rather than nominal INR appreciation. IDR carry also looks interesting in a low yield environment.
Unlike in 2019, we do not think 2020 is the year to look for MXN out-performance. Banxico may be cutting more aggressively than the Fed and our forecast total return of holding MXN against the USD of just 3% in 2020 may prove too thin given the risks.
Of course there are lots of individual stories at play here, which may undermine some of the recommendations made through the above screening process. That is why we encourage our readers to look through the individual currency sections for all the local considerations and the detailed set of forecasts.
Content Disclaimer
This publication has been prepared by ING solely for information purposes irrespective of a particular user's means, financial situation or investment objectives. The information does not constitute investment recommendation, and nor is it investment, legal or tax advice or an offer or solicitation to purchase or sell any financial instrument.Read more
Authors


Included in the following bundle
2020 FX Outlook: Diamonds in the rough
- This bundle contains 7 Articles