Global corn balance set to tighten
CBOT corn has rallied as much as 10% so far this year. Expectations of smaller harvests and a drawdown in global inventories has seen a large amount of speculative buying. Whilst the market is starting to look healthier, inventories currently remain above the 5-year average, which should limit upside for now
Speculative buying and growing volatility
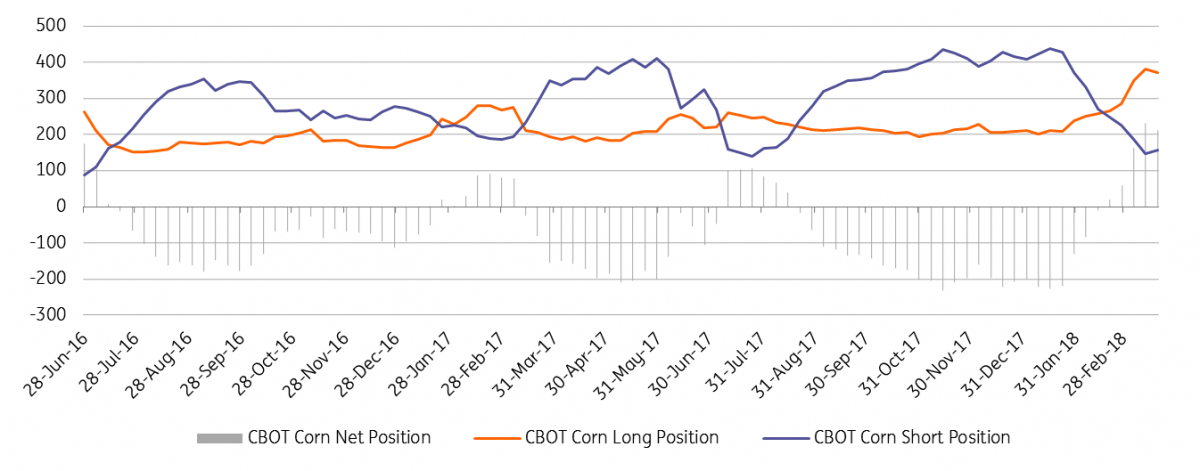
Speculators have switched from a net short of 226,876 lots in mid-January 2018 to a net long of 213,231 lots as of last Tuesday. This has meant that speculators have bought 440,107 lots over the past couple of months. It is this strong buying which has helped the move higher in the market. A large part of the buying has been short covering, with the gross short position falling by 280,848 lots over the period, whilst the gross long position has increased by 159,259 lots over the same period.
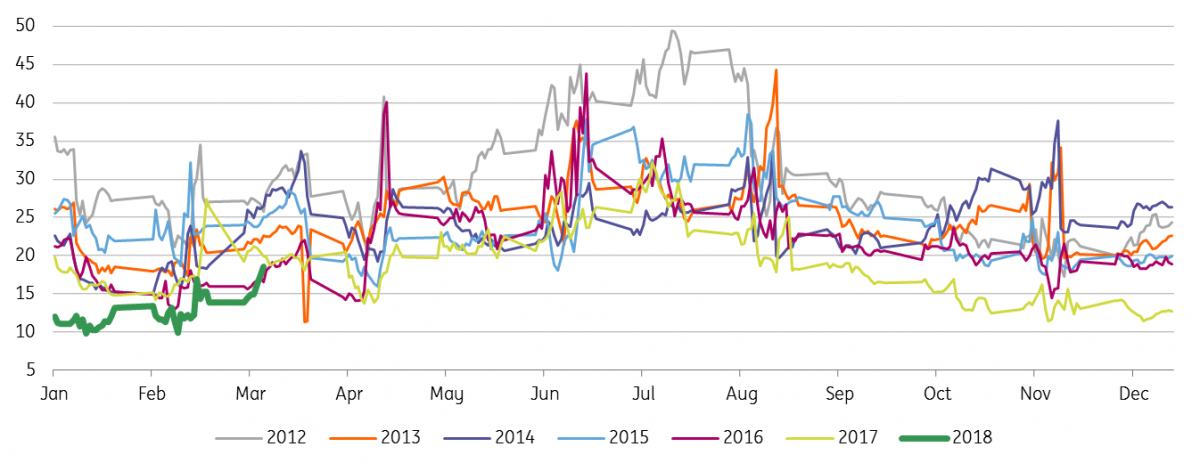
From next week, the USDA will start releasing its weekly crop progress report, and so this will likely be a data point that the market focuses on closely, increasing volatility in CBOT corn. Whilst volatility is historically low at below 20%, it generally does trend higher as we move into the summer, with all eyes on the development of the corn crop in the US.
CBOT Corn managed money net position (000 lots)

CBOT Corn implied volatility (%)

Falling US corn acreage
Back in February, the USDA released its initial projections for 2018/19 US supply and demand. The agency forecast planted corn area to fall marginally. However given the strength in the soybean/corn ratio (which has averaged a little under 2.60 so far this year), we believe that there is downside to the USDA’s current planted corn area projection, and upside to their soybean planted area projection. This Thursday, the USDA will release its Prospective Plantings report, which could see the agency make this adjustment. A recent Farm Futures survey shows that farmers are expected to plant a record 91.5m acres of soybeans and 90m acres of corn. If this turns out to be the case it will be the first time that soybean plantings have exceeded corn plantings in the US.
Weather hurts yields in South America
The soybean market has got most of the attention when it has come to drought conditions in Argentina, with the drier weather leading to regular downgrades in the crop. However it is not just soybeans suffering, corn yields are also under pressure, due to the lack of rain. The Buenos Aires Grain Exchange is forecasting that corn output in the country will total 32mt this season, down from a preliminary estimate of 41mt back in September, and less than the 39mt harvested last season.
Meanwhile, neighbouring Brazil is also set to see a smaller corn crop. Acreage numbers suggest that farmers have increased soybean area at the expense of corn, whilst at the same time yields are expected to fall. As a result CONAB expects that corn output will total almost 87.3mt, down from their January estimate of 92.3mt, and lower than the 97.8mt produced last season.
So what does this all mean?
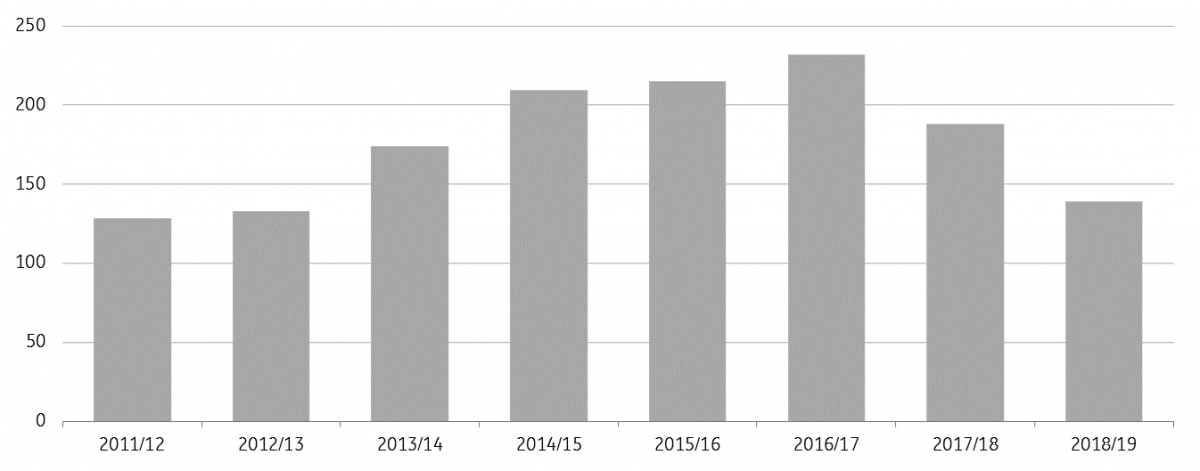
The smaller corn harvest seen in the US and expectations of significantly smaller crops from Brazil and Argentina does mean that ending stocks for the 2017/18 season will likely fall below 190mt - the lowest level since the 2013/14 season, although still above the 5-year average of around 172mt.
The big question however is regarding the 2018/19 season. Initial expectations is that US production will fall due to lower acreage, which means the US domestic balance sheet is likely to tighten further next season.
Elsewhere production will likely marginally increase, assuming that we see a recovery in Brazilian and Argentinian production next season. However, given consumption growth, the global balance is likely to see a second consecutive deficit in 2018/19, and thefore another drawdown in global inventories. This stock decline should support further gradual price strength for the market moving forward, and as a result we are expecting CBOT corn to average a little over US$4/bu in 2019, up from an average US$3.80/bu forecast this year. These forecasts are assuming normal weather conditions moving forward.
Global corn inventories (m tonnes)

This publication has been prepared by ING solely for information purposes irrespective of a particular user's means, financial situation or investment objectives. The information does not constitute investment recommendation, and nor is it investment, legal or tax advice or an offer or solicitation to purchase or sell any financial instrument. Read more
Download
Download snap