Eurozone economic activity remained on downward trend at the turn of the year
Our new nowcasting indicator suggests continued economic weakness at the start of 2021, as lockdowns in large eurozone economies substantially diminish economic activity
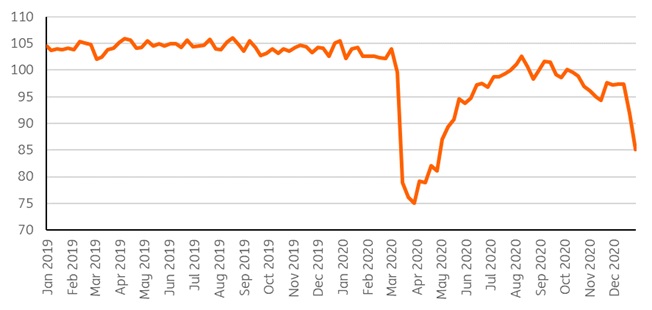
The final week of 2020 saw a sharp drop in economic activity according to our new weekly activity indicator for the eurozone, coming on the back of a few weeks of slightly higher economic activity at the beginning of December. We notice a temporary increase at the beginning of the holiday shopping period after modest declines over the course of October and November. From there on, inactivity due to holidays, as people stayed home for celebrations in small groups, and new lockdowns have caused the index to drop again. Seasonally adjusted data on NO2 emissions also indicate sharp contractions in traffic and industrial production, suggesting that after a strong start to the final quarter, industrial activity also slowed down in the final weeks of the year. Still, compared to the first lockdown, the economic impact of the second wave has been mild so far. Output has been much higher than during the March/April period, on average. While the downturn has been milder, the activity indicator does suggest that the duration of subdued activity is going to be longer, making a dip over the course of two quarters and therefore a technical recession more likely.
Chart 1: ING Weekly Activity Indicator points to very subdued activity at end of year

In a crisis that evolves more by the day than by the quarter, economists have been scrambling to make sense of economic activity with more than the usual monthly or quarterly data sources. As a snapshot indicator, we combine some of the more useful nowcast indicators into a weekly activity index for the eurozone and follow the example of several national central banks, which have come up with similar indicators in recent months. This indicator is in our view particularly useful for the coronavirus crisis as it is designed to detect bigger swings more than small differences in growth rates. For more on the methodology, please read here.
This publication has been prepared by ING solely for information purposes irrespective of a particular user's means, financial situation or investment objectives. The information does not constitute investment recommendation, and nor is it investment, legal or tax advice or an offer or solicitation to purchase or sell any financial instrument. Read more
Download
Download snap