The Dutch Economy Chart Book: Stable profitability for the third year running
Our Dutch Economy Chart Book provides an overview of the many important developments and structural characteristics of the Dutch economy in more than a hundred charts
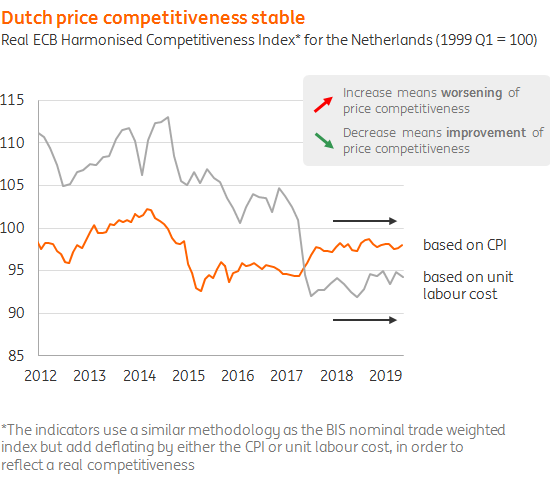
Dutch domestically produced exports have fallen considerably, despite stability in price the competitiveness of the Netherlands. Domestic profitability relative to value-added of non-financial businesses stabilised on a moderate level for the third year in a row, while GDP-growth is still steady. Below, you'll find a summary of the main points. And you can download the full chartbook above.
Domestically produced goods exports fell considerably recently
Dutch export volumes of domestically produced goods fell considerably in the last quarter of 2018 and the first of 2019. This happened despite the fact that the price competitiveness of the Netherlands was roughly stable in the past six months. The slowdown in growth (prospects) of the eurozone, which contains The Netherlands’ most important European trading partners, may be at the root of this. Re-exports performed better than domestically produced exports in the last two quarters.


Domestically produced exports four times as important as re-exports
Despite the fact that the contribution of re-exports (3.8%) to GDP has nearly doubled in twenty years, the contribution of domestically produced goods (16.6%) is still four times as large. If this recently disappointing development of domestically produced goods’ exports continues, GDP-growth may slow down considerably in the period ahead.
World trade outlook bleakest since 2009
So far, Dutch exporters are still rather neutral about their export outlook. However, our projections for world trade for 2019 haven’t been this bleak since the financial crisis. In addition, labour costs are projected to rise faster because of further tightening in the labour market. This may worsen price competitiveness of Dutch exporters. Accordingly, we project total exports to expand by a meagre 1.4% in 2019. To compare: between 1996-2018 export growth was 4.7% on average.
Profitability of non-financial businesses stable at moderate level
Profitability of non-financial businesses has been stable since 2016. And this is happening while overall profitability is already substantially lower than during the previous boom (2006-2008) for quite a while. Nominal pre-tax profits of non-financial businesses are high. In fact, domestic nominal profits were a record high in the first quarter of 2019. However, once we relate profits to the size of the economy – gross operating surplus as a ratio of value-added both of non-financial firms – that profitability appears to be stagnating and even fell in the first quarter of 2019. Now that labour market strains are increasing, further labour cost will continue to increase, leading to our expectation that profitability is more likely to decline rather than increase in the near future.


Share of the oil and gas industry halved since 2012
The share of the oil and gas industry has halved since 2012. For many years, this industry represented almost 3% of the Dutch economy (similar to the current share of temporary job agencies). With the gradual reduction of gas production in the Northern Province of Groningen, the share of oil and gas in total value added fell to 1.3% in 2018. This means that this industry now has a similar share in value added as the automotive sector.

Net gas importer for the first time
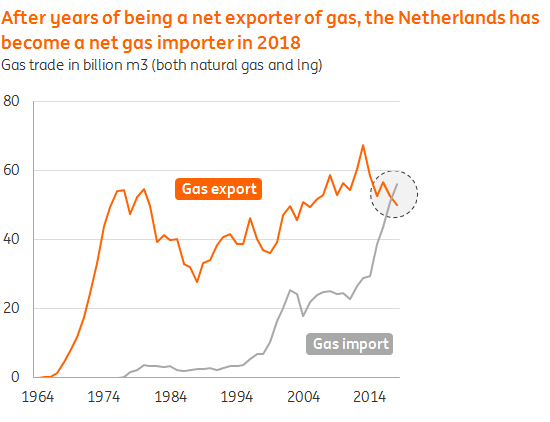
Last year the Netherlands, for the first time, imported more natural gas than it exported. This meant an end to a long history of being a net gas exporter. When Dutch gas production is limited further in the years to come, the share of the oil and gas industry will yet again be halved.

Download
Download report12 July 2019
In case you missed it: Powell to the rescue This bundle contains {bundle_entries}{/bundle_entries} articlesAuthor
This publication has been prepared by ING solely for information purposes irrespective of a particular user's means, financial situation or investment objectives. The information does not constitute investment recommendation, and nor is it investment, legal or tax advice or an offer or solicitation to purchase or sell any financial instrument. Read more
