Dutch Economy Chart Book – The economy of the Netherlands
For the first time since the recovery from the crisis, the number of fixed contracts increased substantially in the Netherlands—a turning point from previous years. This and more is shown by the Dutch Economy Chart Book of ING, which provides an overview of the most important developments of the Dutch economy.
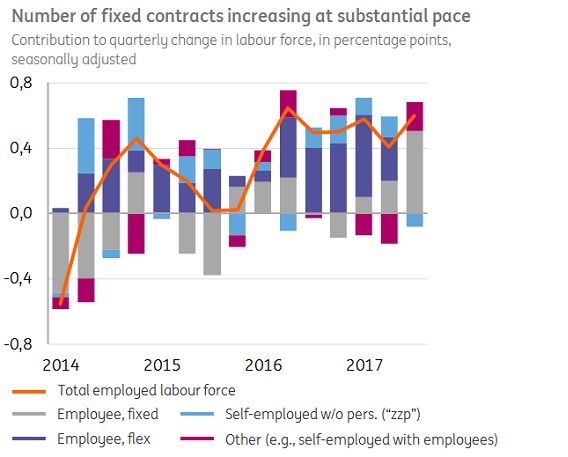
Whether the increase in employment with fixed contracts continues is still uncertain. It is possible that the recent substantial increase is caused by the fact that the labour market is now becoming tighter: the number of unemployed persons per open vacancy has decreased from seven in 2013 to two in 2017.
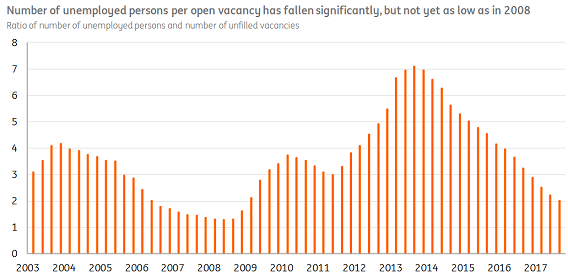
A number of other developments in the Dutch economy stand out from the graphs of the Chart Book:
Exports
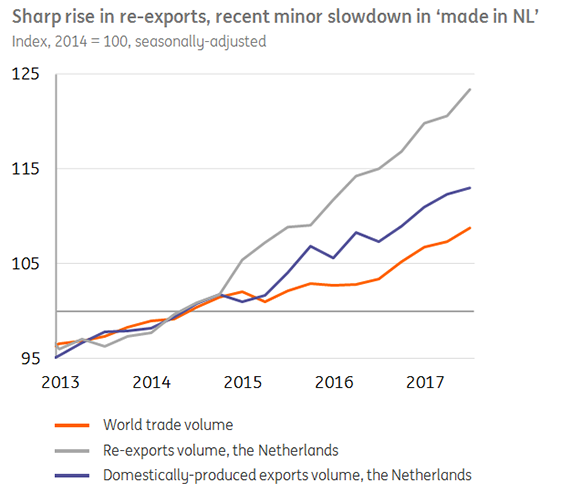
Dutch exports grew faster than world trade in the last few years. This was true for both re-exports as well as for domestically-produced exports. In the last quarter, however, export growth was lower than the growth of world trade.
Non-financial businesses and investment

Total profits of non-financial businesses are currently at record levels, but this number is skewed by income from foreign affiliates. If we look at the profit ratio on domestic activity – the gross operating surplus as a percentage of gross value added – the picture appears to be somewhat different: despite the fact that this ratio is lower than during the crisis, it is nowhere near pre-crisis levels.
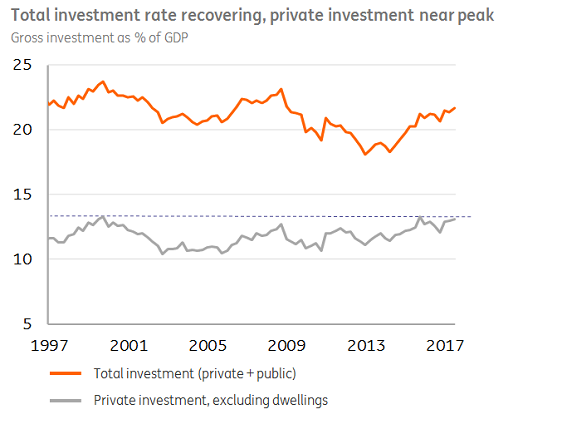
Business investment (excluding buildings) is already close to the pre-crisis peak as a percentage of GDP. The total investment rate has not entirely recovered yet, because of a lower public investment and lower investment in buildings.
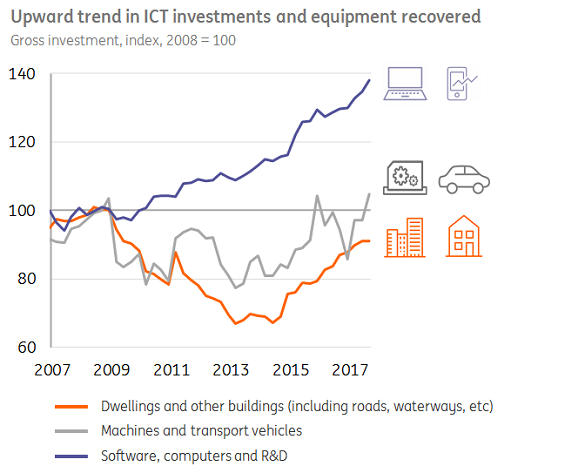
While investment in buildings is lower than before the crisis, significantly more is invested in software, computers and R&D. Investment in machines and transport vehicles has recently passed pre-crisis levels.
Consumers

Dutch households are wealthier than ever before: since 2001, total net wealth has increased by 72%. This is mainly due to the tripling of pension wealth between 2001 and 2016, in line with increased pension liabilities. Furthermore, a large chunk of the housing wealth that was lost during the crisis has returned.
Housing market
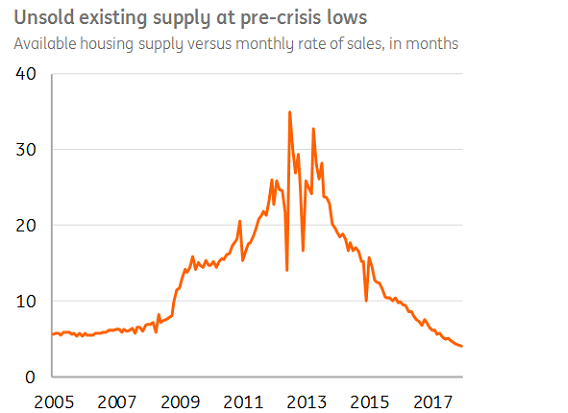
The supply of houses is currently exhausting quickly. This is illustrated by the fact that the existing supply of houses is only four times as large as the number of monthly house sales. At the lowest point of the housing market crisis in 2012, supply was 35 times as large as the monthly sales figure.
Conclusion
All in all, the Dutch Economy Chart Book paints a positive picture of the developments of the economy of the Netherlands.
"All in all, the Dutch Economy Chart Book paints a positive picture of the developments of the economy of the Netherlands," according to Marcel Klok, macro economist at ING. "Accordingly, we are forecasting strong economic growth of almost 3% for this year, which is driven by growth in almost all industries."
See our projections from the recent Eurozone Quarterly.
This publication has been prepared by ING solely for information purposes irrespective of a particular user's means, financial situation or investment objectives. The information does not constitute investment recommendation, and nor is it investment, legal or tax advice or an offer or solicitation to purchase or sell any financial instrument. Read more
