
Where now for the US 10yr rate?
We show why fair value for 10yr SOFR is around 4%. It’s now at 3.4%. Should we get ready for a rise? Yes, eventually. But not yet. First it can get down to as low as 3%. But that’s flat to the forward Fed funds rate. So it can’t stay there. By the turn of the year we will have begun a journey back up to 4%, and a 100bp curve from the funds rate and the 10yr rate
We're on the precipice of a cumulative 225bp in rate cuts from the Federal Reserve. The market is discounting an effective funds rate at 3% by the end of 2025 (versus 5.33% now). Market rates have already moved significantly in anticipation of cuts to be delivered. The 10yr SOFR rate is at 3.4%. That's down over 100bp in just three months. A key question is what now?
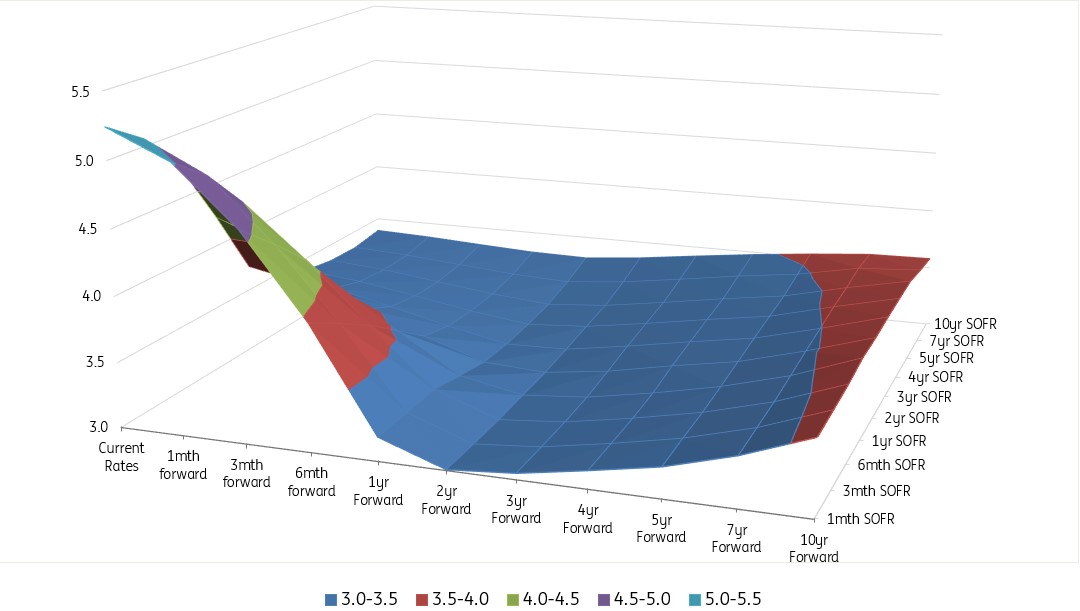
We have some answers, but first the forward discount is worth examining (chart below). It shows the entire curve gapping down to the 3% to 3.5% area on a one year timeframe, and it stays there for five years. Does that make sense? The simple answer is no. If no, what's the more likely prognosis? Read on.
US market rates forward profile shows a (dark blue) dump down to 3% to 3.5% for entire curve
Percent (%)
We're in overshoot territory, but here's why market rates will fall some more
We identify the 3% area as neutral for the Fed funds rate. We back this out from analysis of the noughties. During that decade US inflation averaged c.2%-2.5%, a rate the Federal Reserve finds acceptable. And over the same time period the funds rate averaged 3%. We also find the 3% area theoretically appealing as a neutral rate, one that incorporates a mild positive real rate. And it happens to be the area that the Fed is expected to land at; a return to neutrality.
The same exercise based off the noughties finds the average 10yr Treasury yield was 4.5%. That translates to around 4% for 10yr SOFR, and a fair value 100bp curve between the funds rate and the 10yr SOFR. These are fair value reference levels against which we can interpret current, and indeed future levels.
Why do we use the "noughties" as our reference decade? Remarkably, it is the ONLY decade since the 1960's when inflation AVERAGED at a level acceptable to the Federal Reserve. During every other decade the inflation average has been either too high or too low. The choice is simple – it's the only one that fits! See more here.
Based off that, we can see that the current funds rate is high – it's well above the neutrality area of around 3%. The Fed is about to cut; all good.
But what about the 10yr SOFR rate? It's at 3.4%. That's some 60bp below it's neutral area of around 4%. In that sense, the 10yr SOFR rate is already overshooting to the downside, and away from what we would determine a neutral valuation (in an environment where the funds rate lands at around 3%). Does that mean we should position for a rise in the 10yr SOFR rate? Well yes and no.
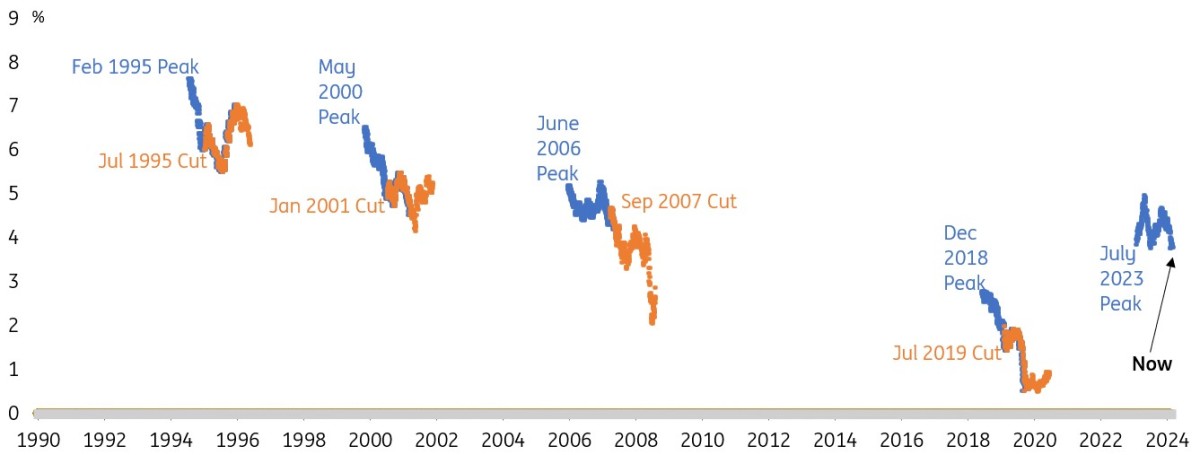
But mostly no for now. There is no great mystery as to why it's below 4%. The Fed is about to embark on a significant rate cutting exercise, and history shows that the 10yr rate tends to fall both in, 1. Anticipation of cuts (from the moment it peaks) and 2. On actual delivery of cuts. The chart below has a zoomed focus on these two periods. In modern times, there has been no exception to the rule that the 10yr rate falls as the Fed cuts.
Long tenor market rates tend to fall as the Fed cuts rates
The 10yr Treasury yield, 1. As the Fed peaks (blue), and 2. As the Fed cuts (orange)
And here's why the 10yr SOFR rate will be drawn back up to 4% (having potentially touched 3%)
Back to the present, the Fed has not started to cut yet. That suggests that 10yr SOFR should still have some room to move lower in the next month or so at least. We'd argue that it could get down to 3%, a 40bp fall from here.
But getting to 3% would also be an extreme valuation to the downside. Why? The Fed funds rate is discounted to get to 3% and no lower. That must represent a floor for all rates right out the curve. There is no relative value logic for a longer tenor rate to trade below 3%. And if they do, say on a mad rate cutting excitement dash lower, there is no logic for them to stay there.
Our analysis shows that a 100bp curve from the funds rate to the 10yr yield is a fair value one. If the funds rate gets pitched at 3%, then 4% is the level we should be thinking about for 10yr SOFR. It of course can be higher or lower based off other pushes and pulls, but it certainly cannot stay at 3%. Even 3.4% (the current level) is too low against a backdrop where arguably a residual inflation risk remains. And where the US fiscal deficit continues to top 6% of GDP, manifesting in material issuance pressure for Treasuries and upward pressure on long rates.
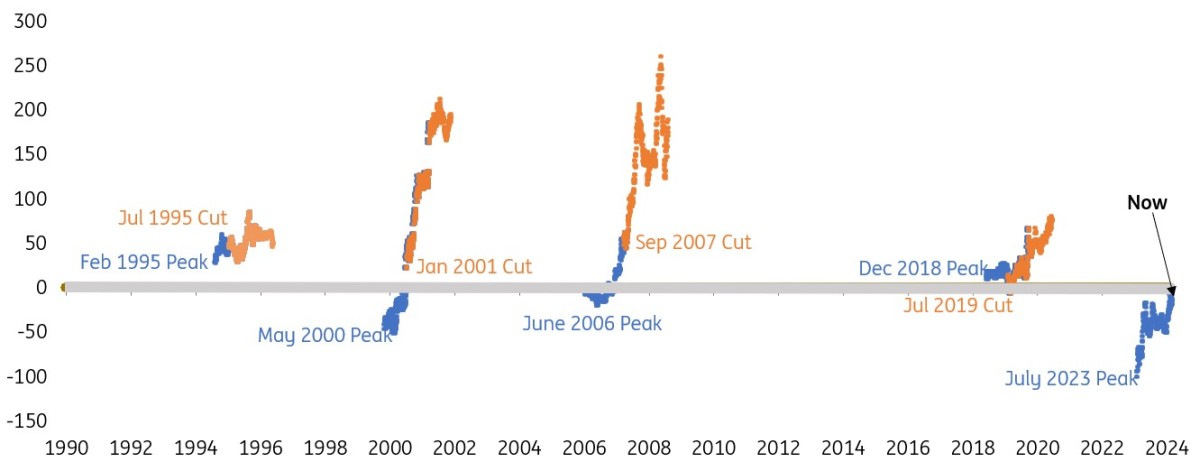
Bottom line, there are good reasons to anticipate the resumption of a much steeper curve; 100bp at the very least. The chart below shows that the curve has tended to get to 100bp to 200bp as the rate cutting process comes to a conclusion. No reason to think differently this time around.
Rate cuts typcially result in a much steeper curve
The 2/10yr Tresury yield spread, 1. As the Fed peaks (blue), and 2. As the Fed cuts (orange)
So what is the answer to the question posed?
First, the 10yr SOFR rate at 3.4% is already in overshoot territory to the downside. But it can overshoot some more. It should not dip below 3% though. If it does hit 3%, it would be flat to the forward discount for the funds rate. That's not a tenable equilibrium level.
Second, the target beyond 3% should be 4% for 10yr SOFR. That assumes what the fund rate strip assumes; that the Federal Reserve cuts by enough to avert a damaging recession and/or a system break, and no more.
If the 10yr SOFR rate does hit 3% we think it will be in the next few months. Post the US elections, and certainly beyond inauguration in January, we think the dominant direction is towards 4%. That is quite a deviant view from the forward discount of an effective structural dump in the entire curve down to the 3% to 3.5% area.
This points to an optimal issuance window now, and over the coming few months. The some obtains for locking in interest rates on liabilities. And for asset managers it points to fading structural longs towards neutral to short positioning over the next few months.
This publication has been prepared by ING solely for information purposes irrespective of a particular user's means, financial situation or investment objectives. The information does not constitute investment recommendation, and nor is it investment, legal or tax advice or an offer or solicitation to purchase or sell any financial instrument. Read more
Download
Download opinion
Padhraic Garvey, CFA
Padhraic Garvey is the Regional Head of Research, Americas. He's based in New York. His brief spans both developed and emerging markets and he specialises in global rates and macro relative value. He worked for Cambridge Econometrics and ABN Amro before joining ING. He holds a Masters degree in Economics from University College Dublin and is a CFA charterholder.
Padhraic Garvey, CFA