Stretching beyond 4% for the US 10yr
The US 10yr yield is on the verge of hitting 4%. It's quite a level. It’s only a few months back that we managed to get above 2%, the culmination of quite a heavy lift that started in 2021. The break above 2% was followed by a snap up to 3%. And now here we are staring at a break above 4%. Where now? We think still higher. But getting much closer to a structural peak
Back to the future. We were at 4% in 2007. Remember what happened then?
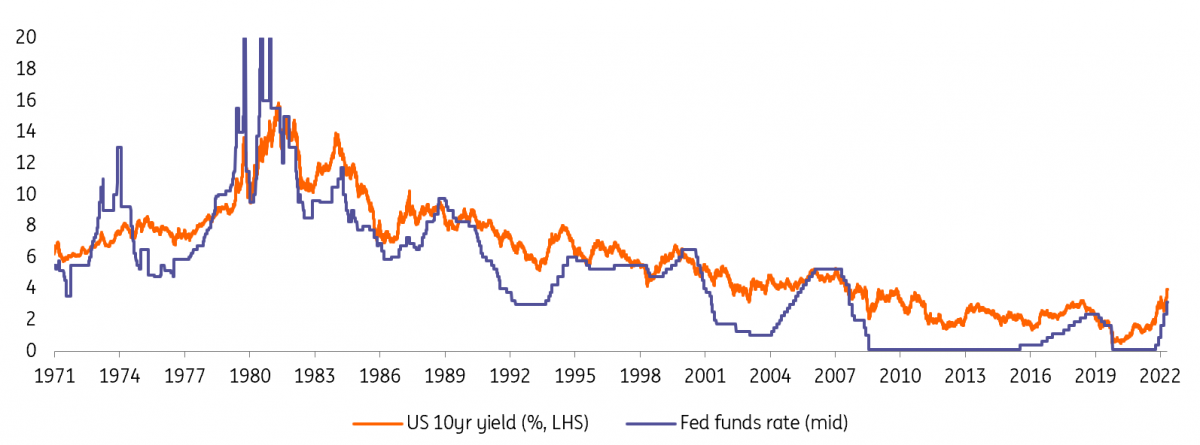
Some context here. The last time we saw 4% was in 2007. Back then rates were journeying down from 5%. We did not know it then, but we were on the eve of the Great Financial Crisis. The Lehman’s moment was not till September 2008, and by the end of 2008 the 10yr had collapsed from 4% down to 2%, one of the most dramatic falls in market rates on record. That’s more of an aside than anything; we’re not necessarilly anticipating a repeat – although we do anticipate a large fall in market rates once they have peaked. The question is – at what level will that be?
We're not at a tipping point yet; still upside to come for market rates
We’re also not at a tipping point just yet, we’re on the preceding side, on the side where market rates are on a rising trajectory. So far, the US economy continues to refuse to lay down, despite the huge internal and external headwinds being thrown at it. This is good, in a way. But in another it’s not, as it can mean that something might need to break before the Fed gets the economy to really slow. And that likely implies ongoing upward pressure on market rates, in tune with the ambition of the Fed to continue to ever-tighten financial conditions. The Bloomberg version now shows that financial conditions are a little over one standard deviation tight versus normal, and it needs at the very least to stay there.
The prognosis now is for the 10yr yield to head for the 4% area, and then likely to head higher; we think to 4.25% (with a risk to 4.5%). Let's explain.
The 10yr goes where the funds rate goes to for a period, but then deviates dramatically

The 10yr can get to 4.25% as the terminal funds rate discount stretches to 4.75%
When the 10yr yield hit 3.5%, we called a peak in that area as the curve structure morphed quickly from a bearish one with the 5yr trading markedly cheap to the curve, to one where the 5yr was outright rich to the curve. This is typical when the Federal Reserve is about two-thirds of the way through the hiking cycle, and tends to mark the beginning of the end of the structural rise in market rates (remember we've come all the way from 50bp in 2020).
The 10yr has now clearly broken above that 3.5% area, and hitting 4% would be another milestone. The 2yr is already at 4.3%, and the Federal Open Market Committee (FOMC) dots extend to 4.6% in 2023. Our go-to model for the 10yr, at this stage of the cycle, is based off an assessment of where the funds rate peaks. This is premised on the historic tendency for the 10yr to trade some 25bp to 50bp through the funds rate on the eve of the peak in the funds rate. See more here.
The market discount for the funds rate is key. Enough to pitch the 10yr at 4.25%
The market discount for the funds rate is key here. Currently that discount is in tune with the median dot at 4.6%, but we need to overlay this with three key points: 1. The direction of travel has been for the rate hike discount to continue to rise, 2. The 2023 median dot rose by 80bp from the June FOMC, and so far the median dot is more likely to be higher than lower by the December FOMC, and 3. There are six dots already dangerously close to 5% from the September FOMC.
So realistically we’re talking about the terminal funds rate being somewhere between 4.5% to 5%. Our view is 4.5%. But while that’s our view, what really matters for the 10yr yield is the market view, as that then pitches the market discount, and by extension fair market value for the 10yr. If we take 4.75% as a central point and then assert that the 10yr can get to 25bp to 50bp through at the peak, then the 10yr can extend to 4.25% (with a risk to 4.5%).
It’s been rapid fire in terms of view updates in the past few months, from 3% to 3.5% to 3.75% and then 4%. We’ve taken this step-by-step, and the common denominator is ongoing upward revisions. We’re now looking at 4.25% (and up to 4.5%).
It feels like that should be getting to something that feels more like a terminal peak. Already the risk free rate plus the median high yield spread pitches the all-in financing rate here in double-digit territory, elevating default risk coming from pure funding pressure. New corporate sector projects also get tougher to rationalize. The same goes for the personal sector where re-financing is an issue, and flexi credit payments hurt. These factors should begin to bite in, allowing the Fed to pause (code for peak).
In such circumstances, and assuming the funds rate does not have to actually hit 5%, then the 10yr can target 4.25% (with a risk to 4.5%).
This publication has been prepared by ING solely for information purposes irrespective of a particular user's means, financial situation or investment objectives. The information does not constitute investment recommendation, and nor is it investment, legal or tax advice or an offer or solicitation to purchase or sell any financial instrument. Read more
Download
Download opinion
Padhraic Garvey, CFA
Padhraic Garvey is the Regional Head of Research, Americas. He's based in New York. His brief spans both developed and emerging markets and he specialises in global rates and macro relative value. He worked for Cambridge Econometrics and ABN Amro before joining ING. He holds a Masters degree in Economics from University College Dublin and is a CFA charterholder.
Padhraic Garvey, CFA
